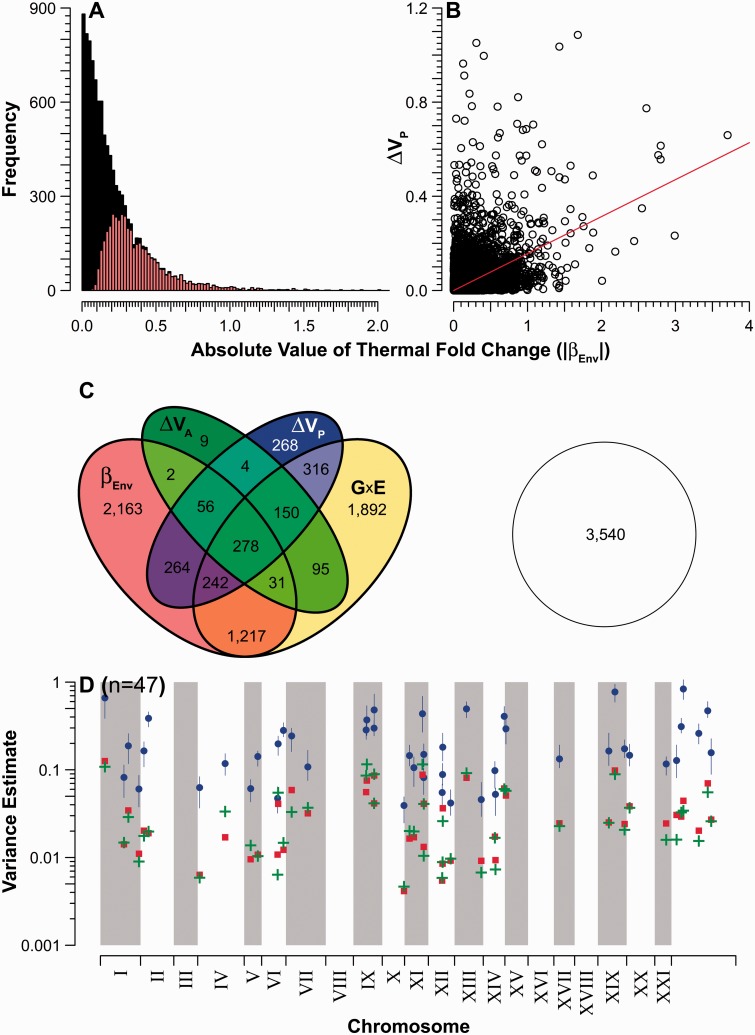
Fig. 2.
Significant temperature effects on transcript expression. (A) Distribution of fixed-effects coefficients describing the effect of thermal treatment on mean transcript expression (βEnv). The gray fraction (colored online) denotes statistically significant values. (B) Relationship between βEnv and ΔVP, the difference in total phenotypic variance estimated in the two temperature treatments. In total, 6,987 transcripts with a temperature response are plotted. (C) Union of transcripts based on their significance with respect to various indicators of environmental effects. Indicators include βEnv, differences in temperature-specific estimates of additive genetic variance (ΔVA), G×E, and ΔVP. Overlapping regions denote multiple significant effects. The open circle represents the proportion of nonsignificant transcripts. (D) Chromosomal location of the 47 transcripts for which the magnitude of ΔVP exceeded interval estimates of both VA and VD. For clarity, only point estimates are provided for VA (+) and VD (squares); circles represent point estimates of ΔVP, bounded by 95% PDIs (vertical lines). Chromosomal arrangement as in figure 1.

