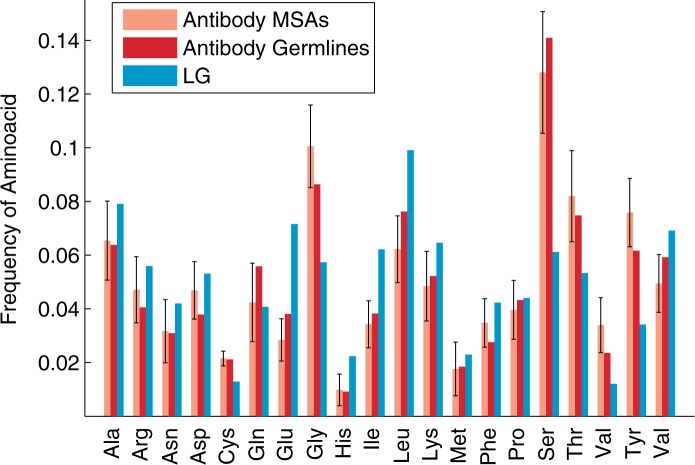
Fig. 4.
The amino acid frequency distributions for the LG model (Le and Gascuel 2008) compared with the antibody-specific distributions that are inferred 1) from the human and mouse antibody MSAs in the training set, and 2) from the germline sequences downloaded from the IMGT database (Lefranc et al. 2009). The error bars show the standard deviations in the amino acid frequencies between different homogeneous (gapless) MSAs constructed from the IMGT data for mouse and human (heavy chain and light chain). The amino acid distribution inferred from the human and mouse antibody MSAs in the test set is recommended for use with the AB model of the antibody maturation process.

