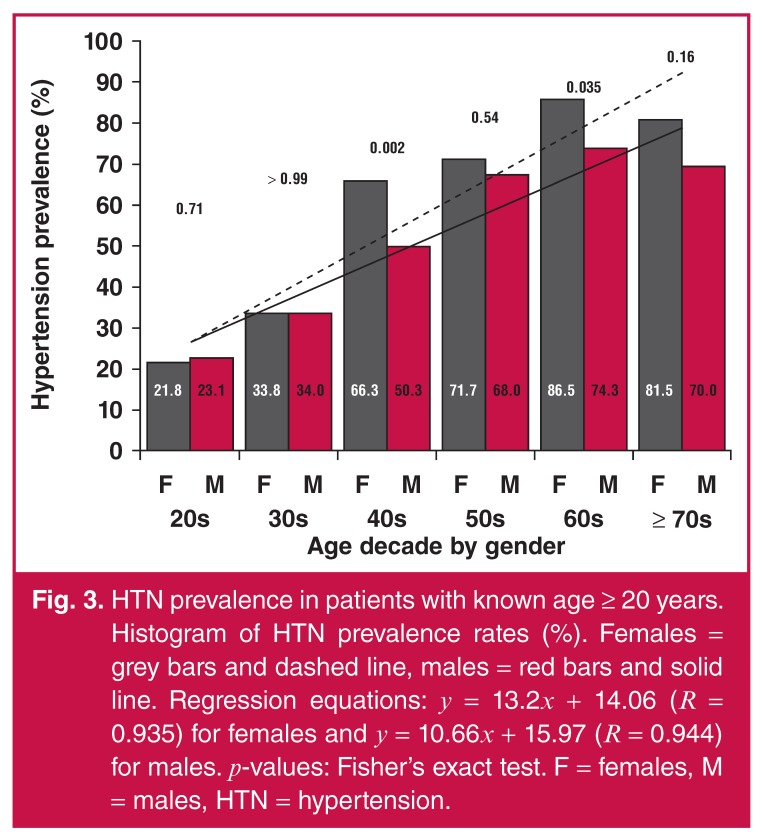
Fig. 3.
HTN prevalence in patients with known age ≥ 20 years. Histogram of HTN prevalence rates (%). Females = grey bars and dashed line, males = red bars and solid line. Regression equations: y = 13.2x + 14.06 (R = 0.935) for females and y = 10.66x + 15.97 (R = 0.944) for males. p-values: Fisher’s exact test. F = females, M = males, HTN = hypertension.

