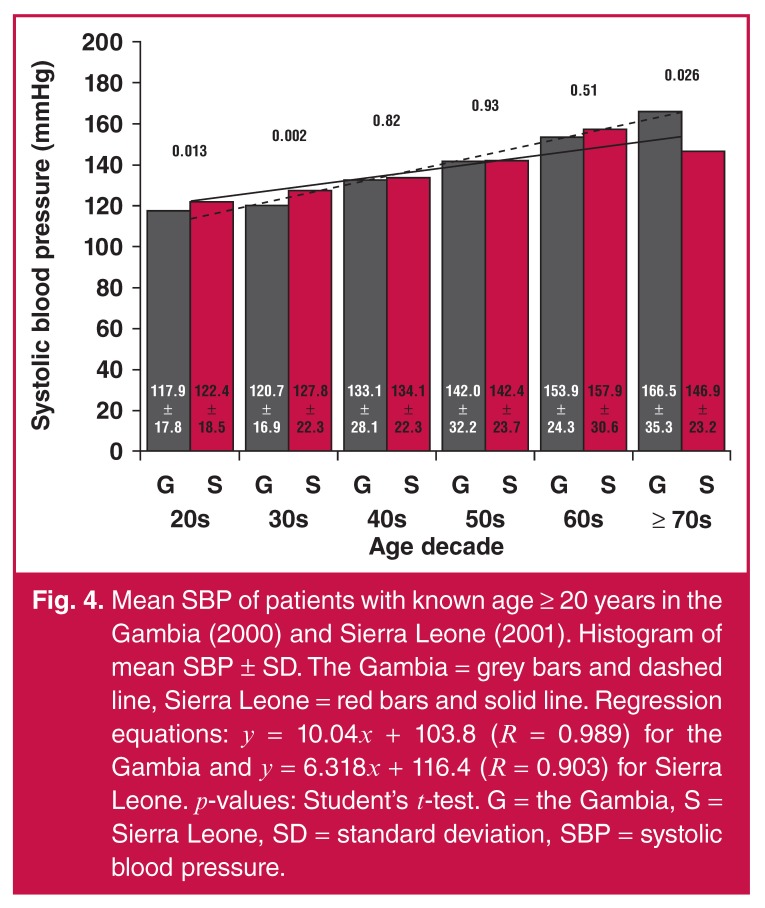
Fig. 4.
Mean SBP of patients with known age ≥ 20 years in the Gambia (2000) and Sierra Leone (2001). Histogram of mean SBP ± SD. The Gambia = grey bars and dashed line, Sierra Leone = red bars and solid line. Regression equations: y = 10.04x + 103.8 (R = 0.989) for the Gambia and y = 6.318x + 116.4 (R = 0.903) for Sierra Leone. p-values: Student’s t-test. G = the Gambia, S = Sierra Leone, SD = standard deviation, SBP = systolic blood pressure.

