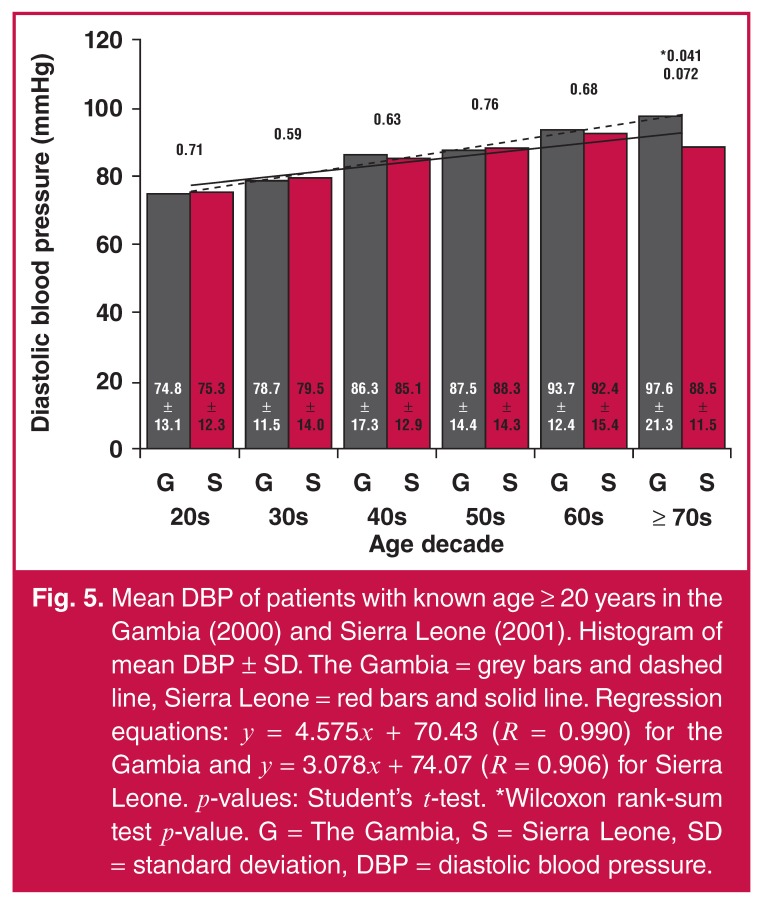
Fig. 5.
Mean DBP of patients with known age ≥ 20 years in the Gambia (2000) and Sierra Leone (2001). Histogram of mean DBP ± SD. The Gambia = grey bars and dashed line, Sierra Leone = red bars and solid line. Regression equations: y = 4.575x + 70.43 (R = 0.990) for the Gambia and y = 3.078x + 74.07 (R = 0.906) for Sierra Leone. p-values: Student’s t-test. *Wilcoxon rank-sum test p-value. G = The Gambia, S = Sierra Leone, SD = standard deviation, DBP = diastolic blood pressure.

