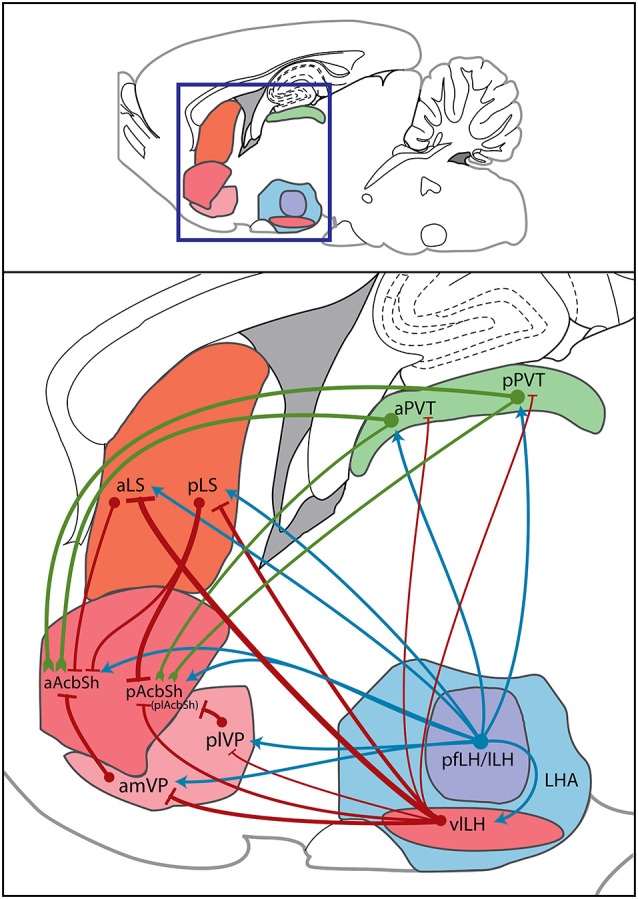
Figure 4.

Sagittal diagram of direct hypothalamic and indirect trans-pallidal, trans-thalamic, and trans-septal innervation of the AcbSh. Within a sagittal plane, the boxed region designates an area of the rat forebrain within which the regions of interest reside (top panel); this area is magnified to show sources of AcbSh innervation (bottom panel). Subregions of the LH area (LHA), the pfLH, lLH, and vlLH, project both directly to the AcbSh and to other regions that project onward to the AcbSh. Green lines indicate glutamatergic signals, red lines indicate GABAergic signals, and blue lines indicate mixed or neuropeptidergic signals. Circles indicate cell bodies. Line thickness denotes “strength” of connections. Such strengths were determined by amounts of anterogradely labeled fibers or retrogradely labeled cells observed in prior studies of each specific projection. This sagittal template was modified from a brain atlas (Paxinos and Watson, 2013). plAcbSh—posterolateral AcbSh.
