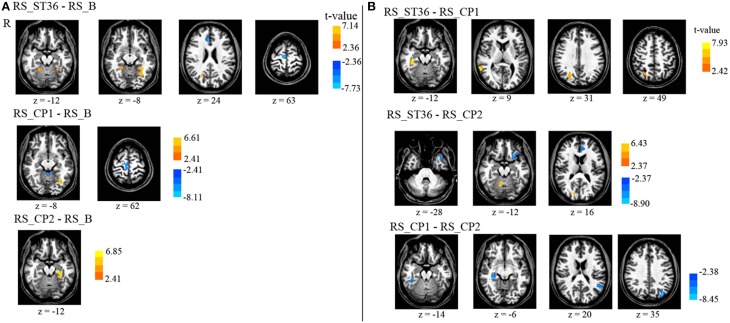
Figure 4.
Comparison of the seed-based somatosensory resting-state connectivity between all resting-state sessions (P < 0.05, corrected). (A) The comparison of post-stimulation resting-state scans with the baseline scan. (B) The comparison of the post-stimulation resting-state scans with each other. There is no cluster surviving the conjunction analyses across the first and second row (acupuncture vs. control points) as well as across the second and the third row (dermatome L5 vs. L2). R means right hemisphere. Talairach z coordinates are displayed. positive values: red, negative: blue.

