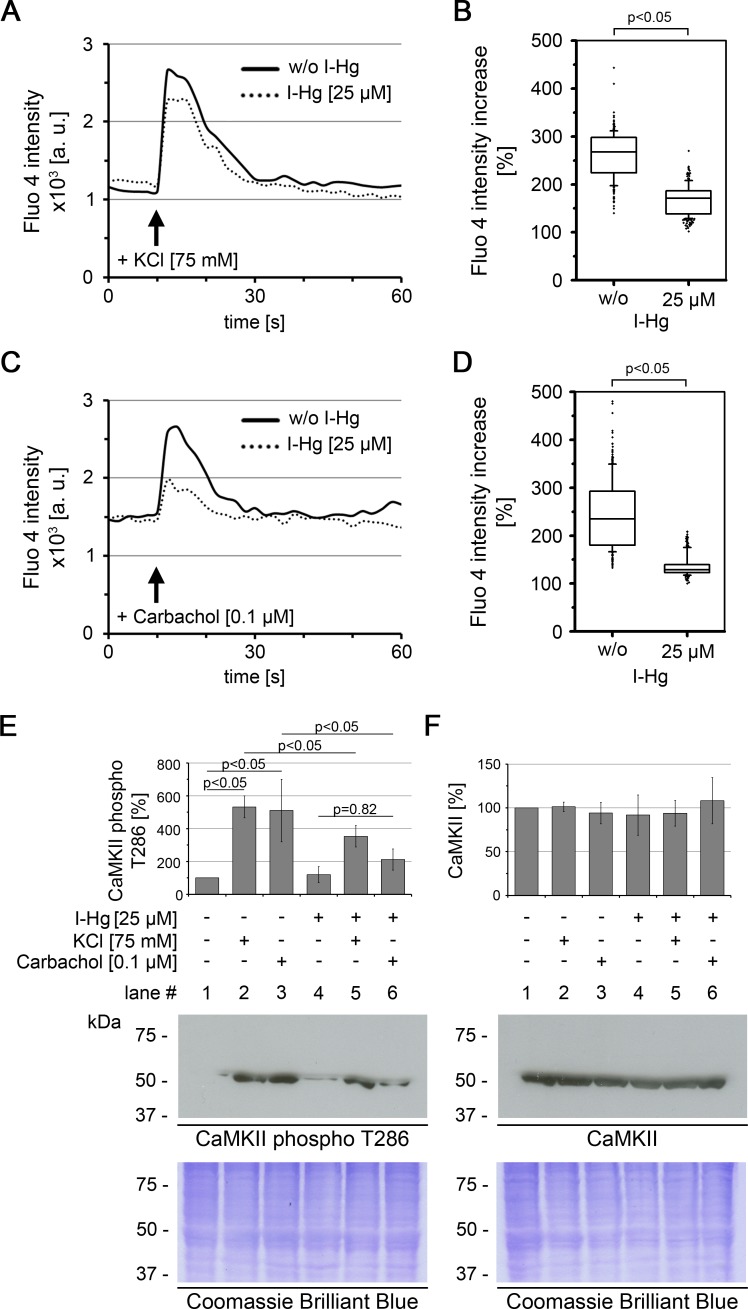
Figure 1. I-Hg reduces Ca2+-signalling in SH-SY5Y neurons.
Intracellular Ca2+ of untreated or I-Hg-treated neural SH-SY5Y cells was monitored by the Fluo-4 DirectTM assay. Cells were imaged by time-lapse confocal laser scanning microscopy with low resolution/high speed settings. After 10 s cells were stimulated with either (A, B) KCl (75 mM) or with (C, D) the cholinergic agonist carbachol (0.1 µM). (A, C) Intracellular fluorescence intensity of representative single cells was measured with MetaMorph software and plotted as intensity (a.u.) over time (s). Continuous curve, untreated SH-SY5Y cells; dashed curve, I-Hg-treated SH-SY5Y cells. (B, D) Ca2+-fluctuations were quantified by calculation of the intensity increase after stimulation as percentage (%) of the base-line intensity. Results of three independent experiments were pooled and are presented as box plots (KCl/w/o I-Hg, n = 312 cells; KCl/+I-Hg, n = 291 cells; carbachol/w/o I-Hg, n = 311 cells; carbachol/+I-Hg, n = 301 cells). P-values of nonparametric Mann–Whitney tests indicate significant differences between untreated and I-Hg-treated cells. (E) Expression of T286-phosphorylated CaMKII and (F) total CaMKII was analyzed by immunoblotting. Untreated or I-Hg-exposed neural SH-SY5Y cells were either left unstimulated or additionally stimulated with KCl or carbachol. Bar graphs show mean values and standard deviations of densitometric analyses of three independent experiments. P-values (p < 0.05) indicate significant differences (one-way ANOVA with Tukey’s post-hoc test). Corresponding Coomassie Brilliant Blue staining confirms equal protein loading. A.u., arbitrary units; s, seconds.

