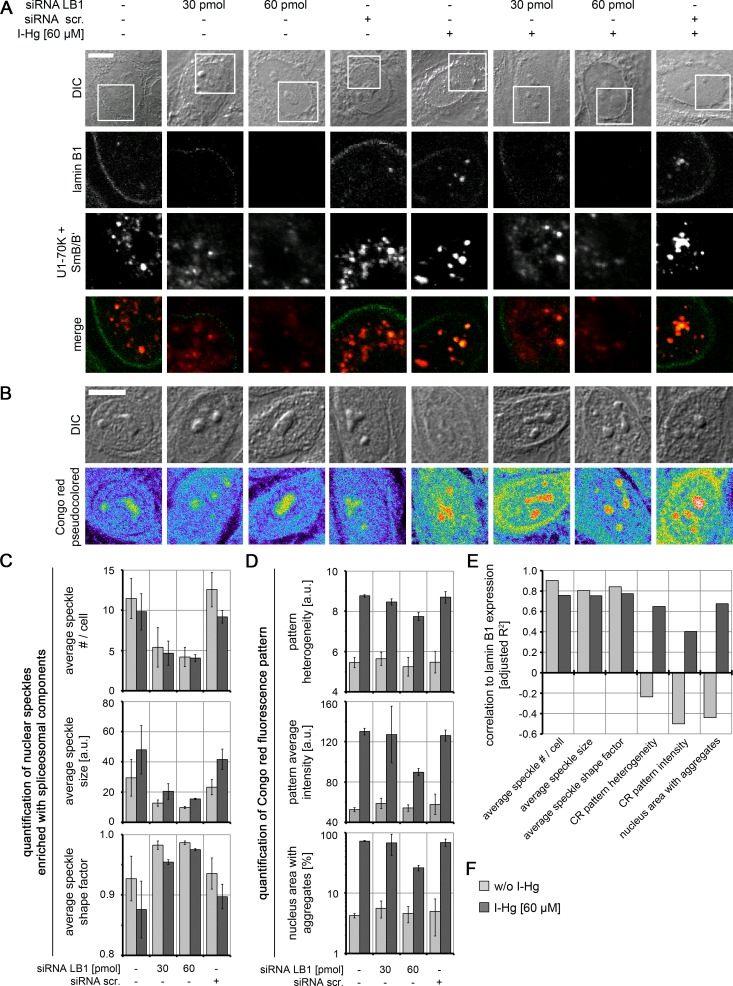
Figure 5. Nucleoskeletal protein lamin B1 regulates formation of I-Hg-induced nuclear amyloid.
Increasing concentrations of short interfering RNAs (siRNAs, 30 pmol and 60 pmol) were used to deplete lamin B1 in untreated or I-Hg-treated HEp-2 cells. Reduced lamin B1 expression was confirmed by immunoblotting (Fig. S8). Controls include untreated or HEp-2 cells treated with scrambled, random siRNA (siRNA scr.). Cells were double-immunolabelled for lamin B1 and splicing components U1-70K/SmB/B’. (A) shows representative DICs of HEp-2 cells (top row) and indicated blow ups of respective nuclear envelope or nucleoplasmic regions with labelled lamin B1 (green) and U1-70K/SmB/B’ (red) in single fluorescence channels and merge. Yellow staining indicates colocalization of nucleoplasmic lamin B1 and nuclear speckles enriched with splicing components. (B) To investigate influence of lamin B1 depletion on amyloid formation, untreated or I-Hg-treated HEp-2 cells were stained for Congo red-positive microenvironments. Representative cells are shown in DIC and fluorescence channels (i.e., pseudocolored micrographs). Bars, 5 µm. (C) Immunostained nuclear speckles enriched with spliceosomal components were quantified using the Integrated Morphometry Analysis tool in Metamorph. Nuclear speckles were detected by intensity threshold and analysed for (i) average number of speckles per nucleus, (ii) average speckle size as (a.u.) and (iii) average speckle shape (shape factor = 1: round; shape factor < 1: reticulated). (D) shows quantification of the nuclear Congo red fluorescence pattern, as described previously (Arnhold & von Mikecz, 2011). The parameters for (i) Congo red pattern heterogeneity (a.u.), (ii) Congo red pattern intensity (a.u.) and (iii) nucleus area with Congo red positive aggregates (%) were used to quantitatively characterize nuclear protein aggregation/fibrillation. (C, D) show mean values and standard deviations of three independent experiments. (E) Correlation of lamin B1 depletion with nuclear speckle and Congo red pattern characteristics is calculated by linear fit analysis. Expression values of lamin B1 were determined by immunoblot analysis (shown in Fig. S8). Mean values of three independent experiments (presented in (C, D) and Fig. S8) were used to calculate correlations. The detailed correlation analysis is shown in Fig. S9 A.u., arbitrary units; I-Hg, inorganic mercury; LB1, lamin B1.

