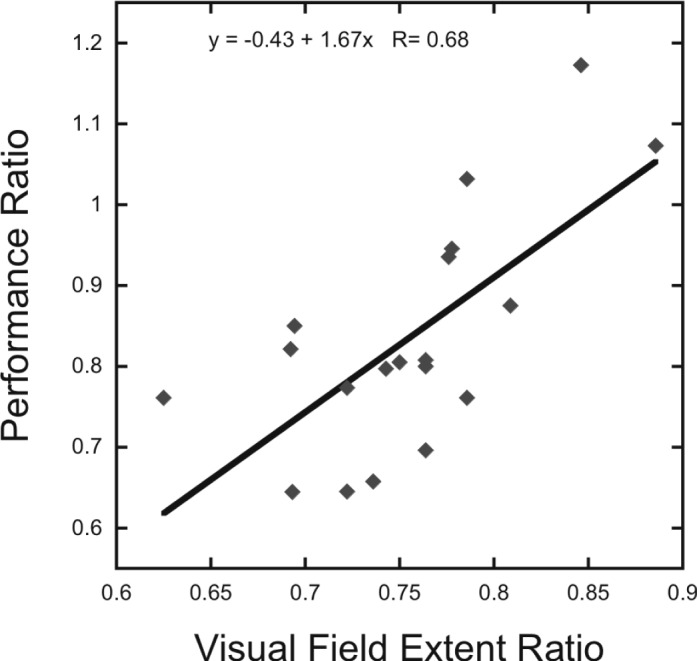
Figure 3.

Upper/lower asymmetry in visual field extent predicts magnitude of upper/lower perceptual asymmetry across individual participants. The magnitude of the upper/lower performance ratio for the crowded conditions at 20° (averaged across contrast levels) is highly correlated with the upper/lower visual field extent ratio. Each data point represents one participant. Solid black line indicates linear regression.
