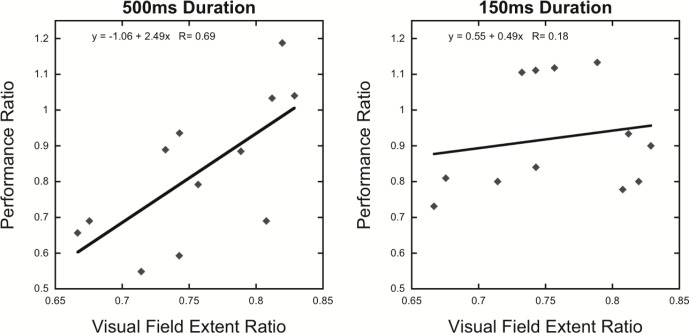
Figure 8.
Upper/lower visual field extent asymmetry predicts magnitude of upper/lower perceptual asymmetry for 500-ms but not 150-ms grating durations. Left panel: Performance ratio for the 500-ms grating duration. Right panel: Performance ratio for the 150-ms grating duration. Subjects monitored both target locations in every trial. Each data point represents one participant. Solid black lines indicate linear regressions.

