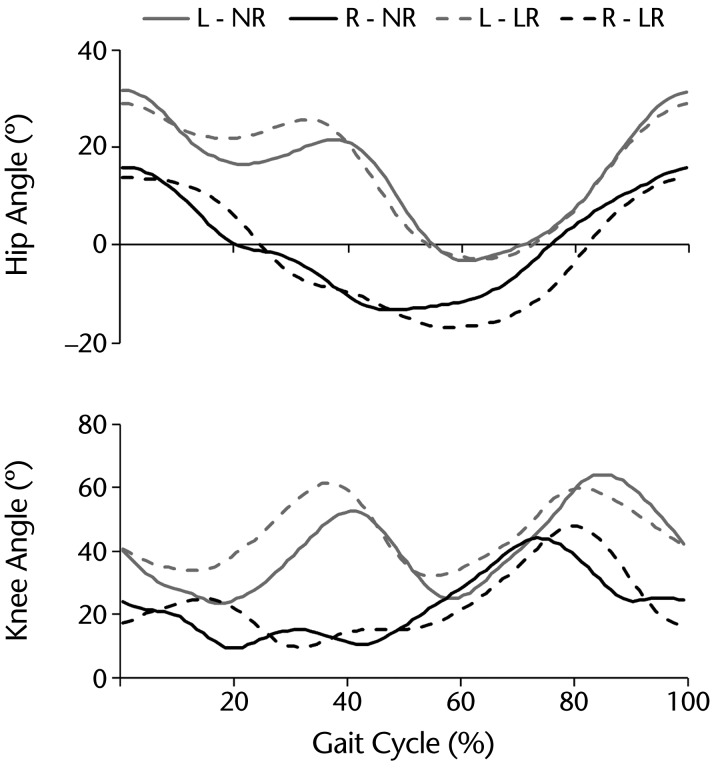
Figure 1.
Graphic representation of the resistance added during training. Hip and knee joint angles during the gait cycle for the left (L; gray lines) and right (R; black lines) sides are plotted to show nonresistance (NR; solid lines) and Lokomat resistance (LR; dashed lines) walking. Average joint angle curves were calculated from 25 steps and normalized to the percentage of the gait cycle time (0% [heel-strike]–100% [subsequent ipsilateral heel-strike]). Upward deflections represent flexion.

