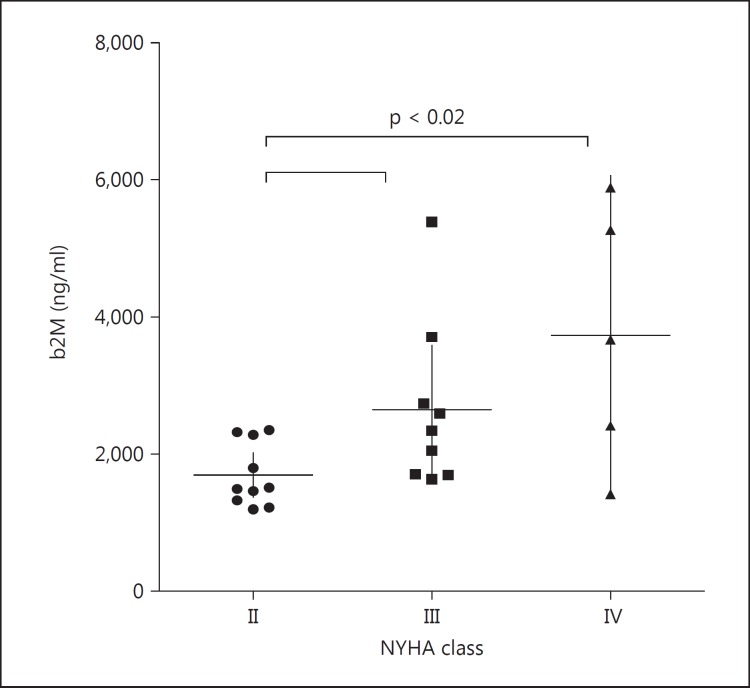
Fig. 3.
b2M values in CHF patients of different NYHA classes (from II to IV). Patients in NYHA classes III and IV show higher levels of b2M compared with patients in NYHA class II. Median values and 25th-75th percentiles are indicated by horizontal and vertical lines, respectively. Significant differences (p value) between the groups are given in each graph.

