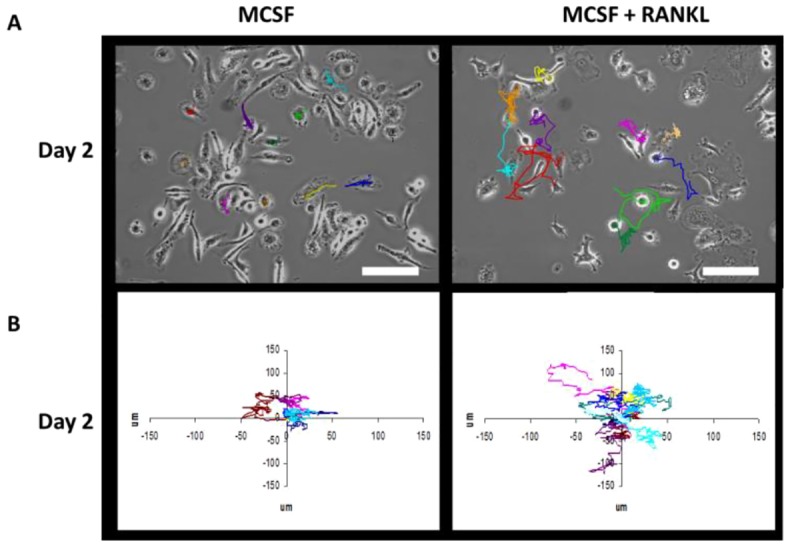
Fig. 2.

Motility tracking from 10 individual cells on day 2 of mBMM culture. mBMMs were treated with MCSF alone (left panels) or MCSF plus RANKL (right panels) and imaged by time-lapse video microscopy. (A) Representative phase-contrast images at time 0 (10×objective) are shown. The colored lines depict the movements of individual d2 pre-osteoclasts from the point of origin to the end of the imaging time. Tracking of individual cells showed increased cell migration with RANKL treatment. (B) Individual motility tracks (Cartesian plots; µm) from ten d2 pre-osteoclasts normalized to the point of origin at 0.0. Increased movement stimulated by RANKL treatment is apparent. Scale bars: 100 µm.
