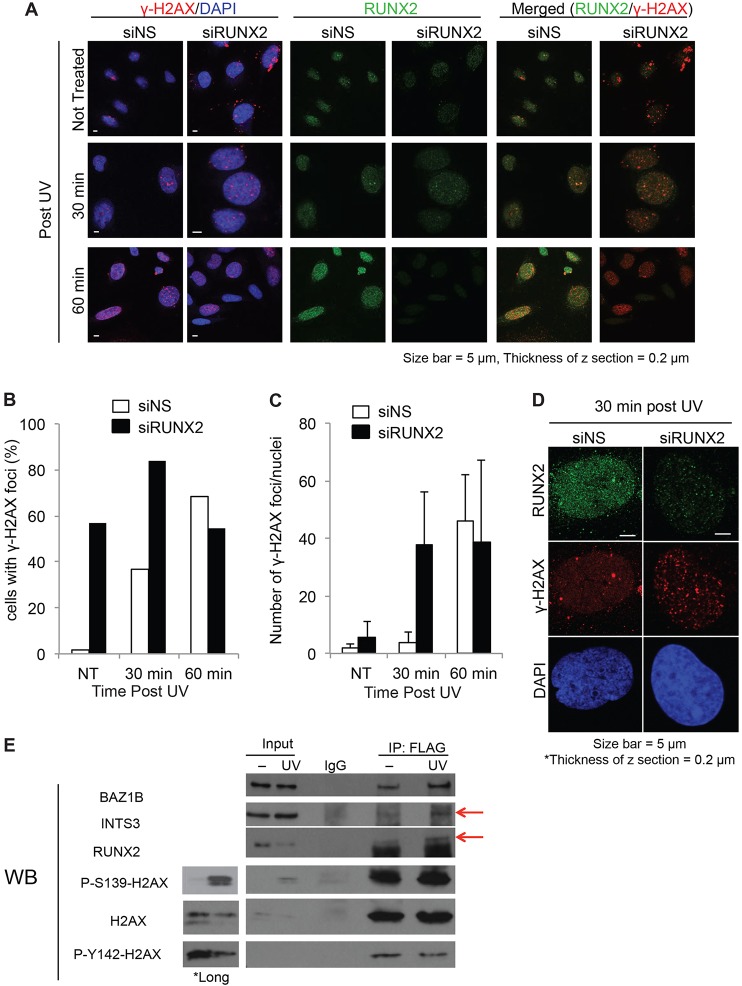
Fig. 7.
RUNX2 association with γ-H2AX by UV irradiation. Saos2 cells transfected with nontargeting siRNA (siNS) or RUNX2-targeting siRNA (siRUNX2) were not treated with radiation (NT) or were UV-irradiated (300 J/m2). (A) After UV irradiation, cells were incubated for 30 or 60 min, then permeabilized, fixed and co-stained with RUNX2 (green) and γ-H2AX (red) antibodies and analyzed by confocal microscopy. (B) Cells showing γ-H2AX foci in the nucleus were counted. The graph shows the ratio of the number of cells with nuclear γ-H2AX foci to the total cells in the field; 3–14 cells were counted per field, and at least 9 fields were counted per treatment. (C) The number of γ-H2AX foci per nucleus was counted and plotted; ≥36 cells were analyzed for each data point. The data show the mean±s.d. (D) Representative confocal images from 30 min after UV irradiation are shown. (E) Saos2 cells were transfected with the FLAG–H2AX expression construct, UV irradiated or left untreated, then FLAG–H2AX protein was immunoprecipitated (IP) and analyzed by western blotting (WB). Because the intensity of ECL signal from Ser139 phosphorylation on H2AX from input lanes was low, we included longer exposures of the blot for Ser139 phosphorylation (P-S139-H2AX) and total H2AX input lanes. The upper band from the P-S139-H2AX and H2AX blots corresponds to overexpressed FLAG–H2AX and the lower band is from endogenous H2AX. *Long indicates data from a longer exposure of blots for ECL detection. Bands corresponding to INTS3 and RUNX2 are indicated with red arrows.

