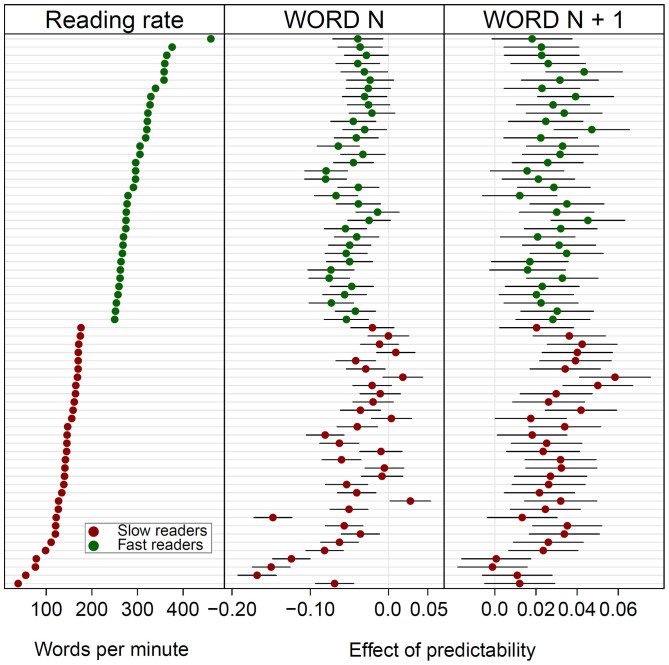
Figure 4. “Caterpillar plots” of the reading rate and the effects of wordn and wordn+1 predictability on gaze duration (GD) of the slow and the fast readers.
The vertical bars represent the 95% prediction intervals. Fixed effects with a negative sign (i.e., left of the vertical mid-line) indicates decreasing GD with increasing predictability; fixed effects with a positive sign indicate increasingly longer gaze duration with increasing predictability. Participants are ordered by reading rate.

