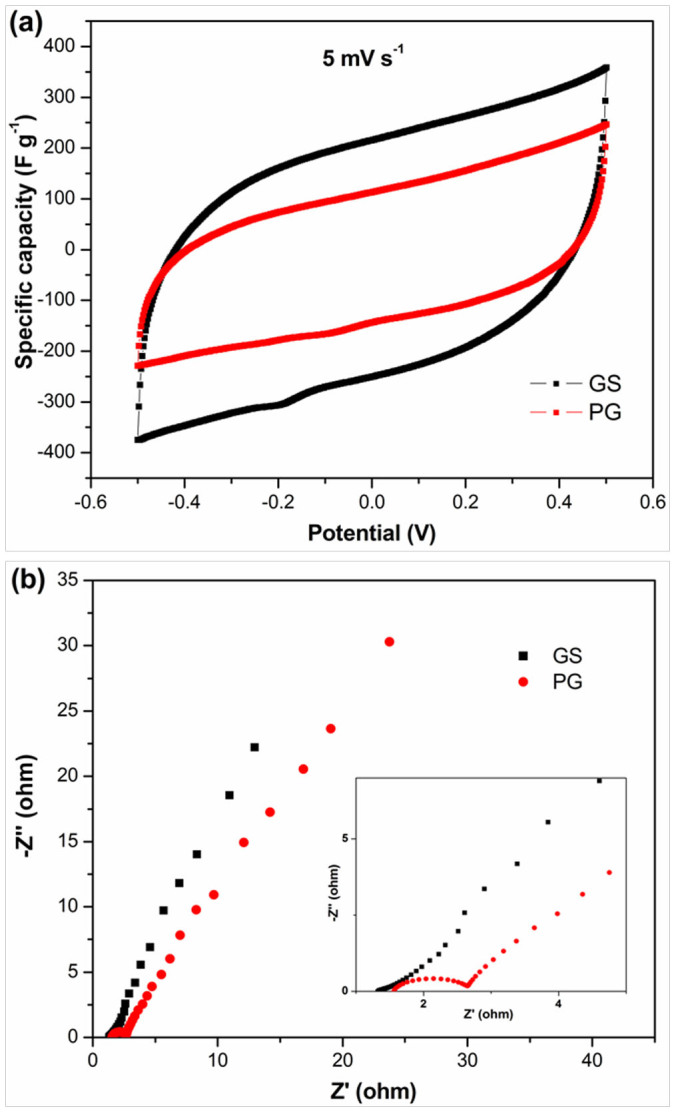
Figure 4. (a) CV curves of GS and PG measured at a scan rate of 5 mV s−1 and (b) Nyquist plots of GS and PG electrodes in 1 M NaCl aqueous solution.

Inset of (b) is the corresponding expanded high-frequency region of the plots.

Inset of (b) is the corresponding expanded high-frequency region of the plots.