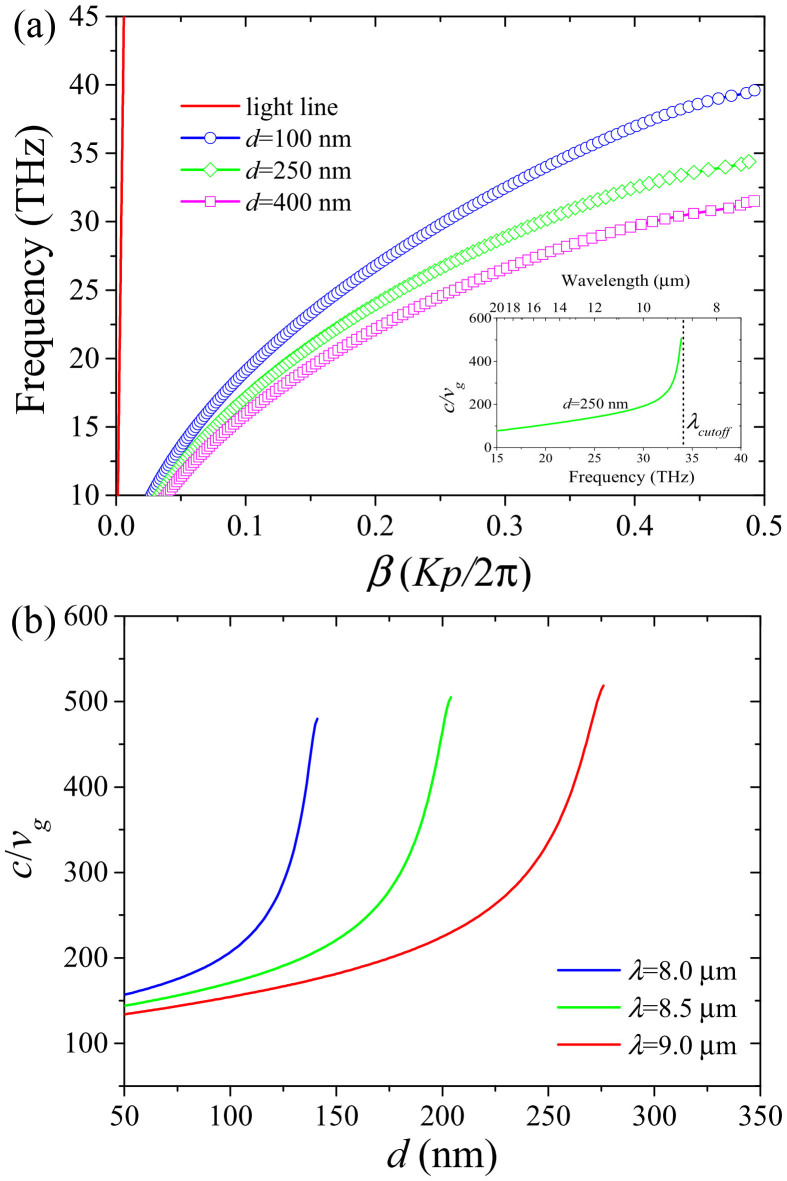
Figure 2. Dispersion curves and group indices of the graphene Bragg grating.
(a) Dispersion curves for different substrate groove depth in the graphene based Bragg grating structure. β is the reduced propagation constant with a unit of Kp/2π. K is the Bloch vector of the SPP mode along the x axis and p is the period of the silica grating. The inset shows the group index (slowdown factor) as a function of frequency (and wavelength) for d = 250 nm. λcutoff denotes the cutoff wavelength. (b) Group indices as a function of d for different operating wavelengths. In the calculations, t = 100 nm, p = 40 nm, w = 20 nm, Vb = 60 V, μ = 20000 cm2V−1s−1 and T = 300 K.

