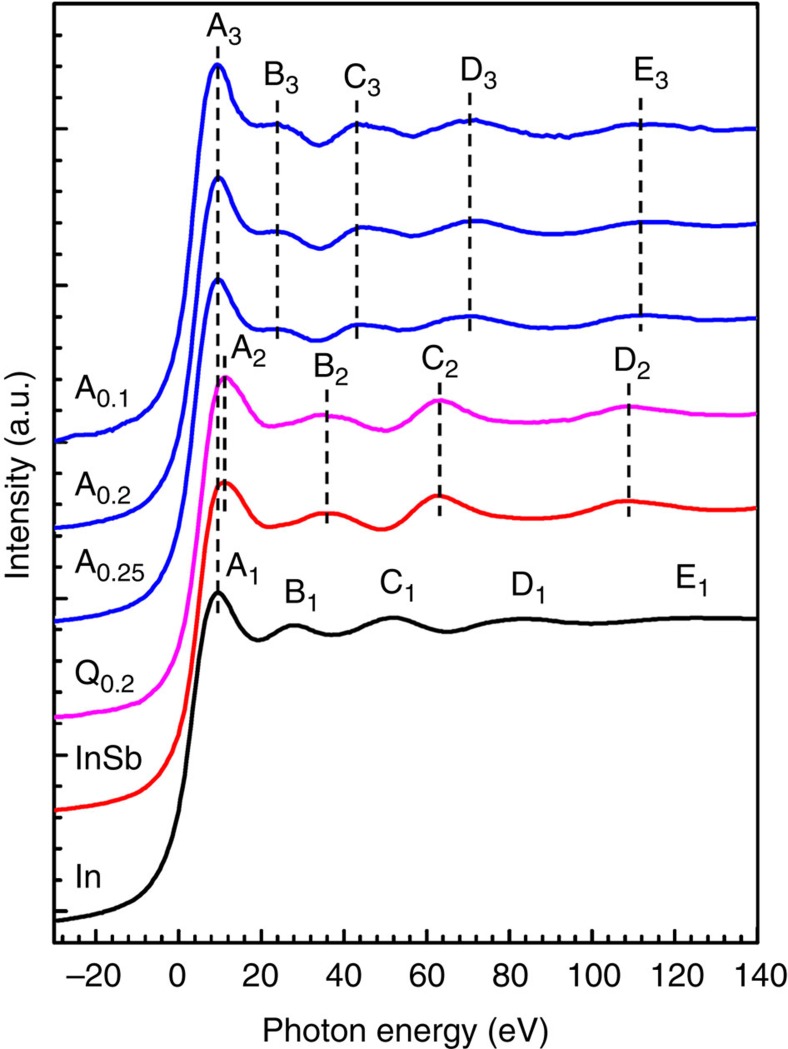
Figure 1. The In K-edge XANES experimental spectra.
The quenched In0.2Co4Sb12 is symbolized with ‘Q0.2’. The annealed InxCo4Sb12 (x=0.1, 0.2 and 0.25) is symbolized with ‘Ax’. The In K-edge XANES experimental spectra of InSb and In metals are plotted for comparison. Zero eV corresponds to the threshold of In K-edge (27,940 eV).

