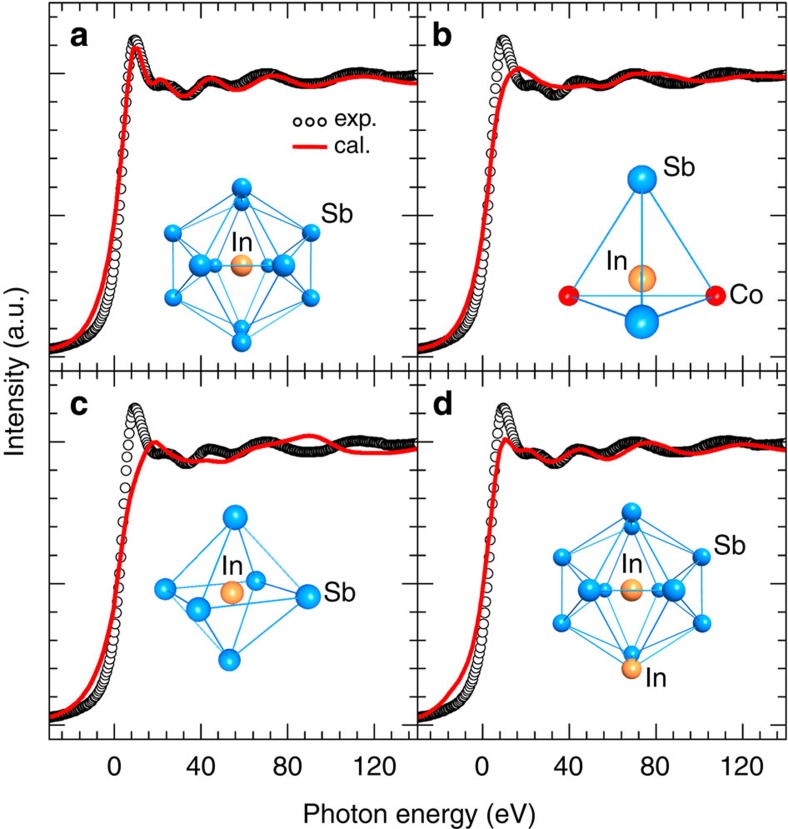
Figure 2. The In K-edge XANES spectra of In impurity in CoSb3.
(a) Filling Sb12 icosahedron voids at the 2a sites, (b) substituting for Sb at the 24g sites, (c) substituting for Co at the 8c sites and (d) simultaneously filling the icosahedron voids at the 2a sites and substituting for Sb at the 24g sites. The In K-edge XANES experimental spectra of A0.25 are plotted for comparison. The XANES theoretical spectra are shown with red solid lines and symbolized as ‘cal.’. The XANES experimental ones are shown with black circle lines and symbolized as ‘exp.’.

