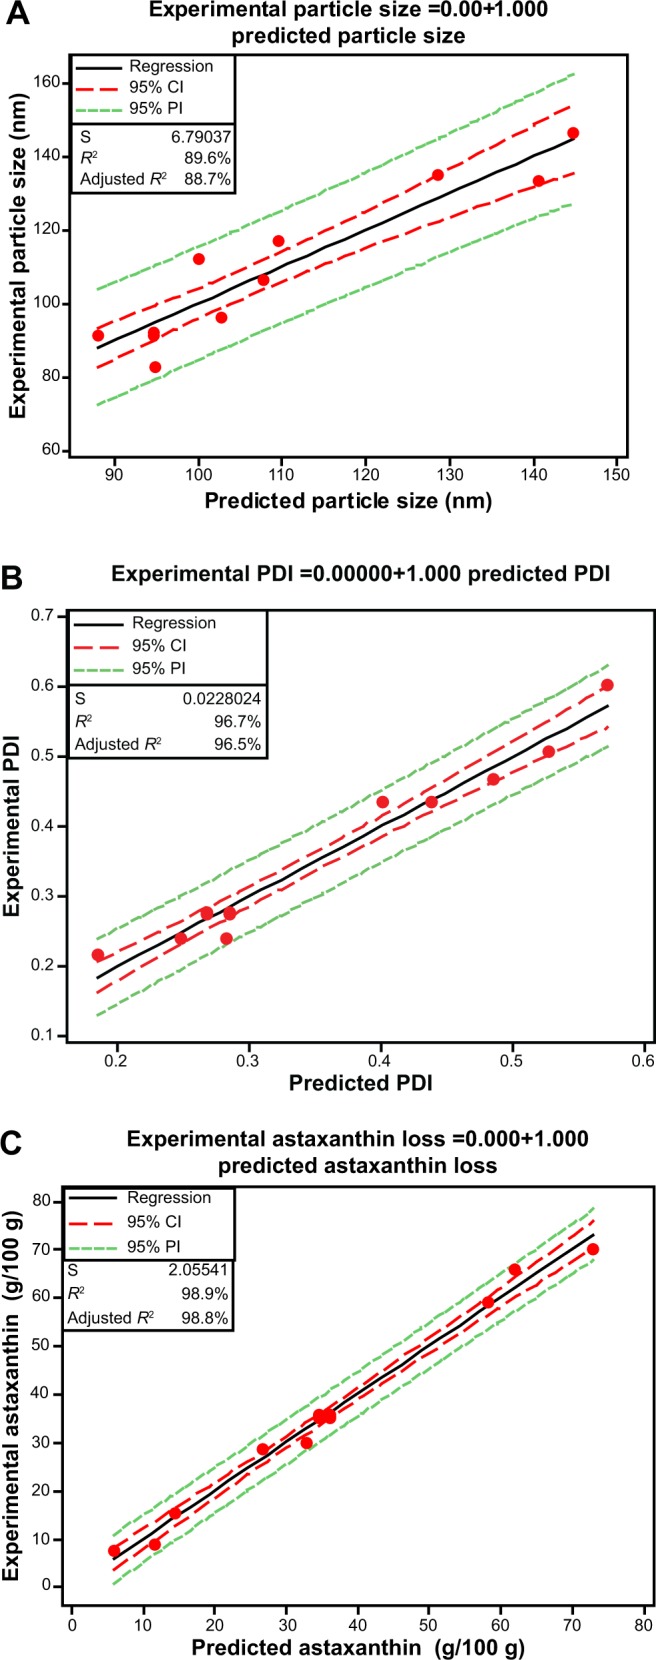
Figure 3.

Fitted line plots between the experimental and predicted values for (A) mean particle size, (B) PDI and (C) astaxanthin loss; dashed lines (- -) and dotted lines (….) show 95% CI and 95% PI, respectively.
Abbreviations: CI, confidence intervals; PDI, polydispersity index; PI, predicted intervals.
