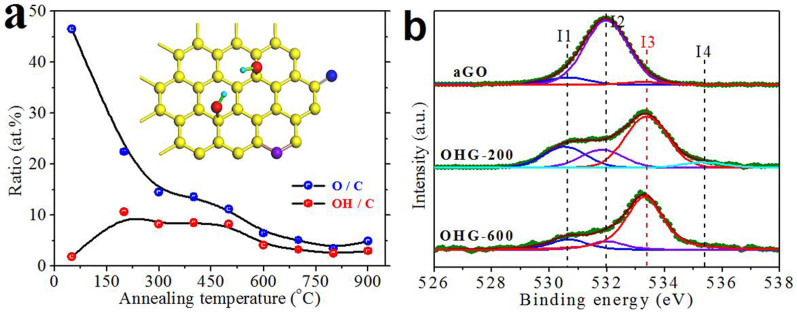
Figure 2. O content and its bonding environments of aGO and the OHG samples obtained at different annealing temperatures.
(a) Dependences of oxygen to carbon ratio (O/C, blue dots) and OH coverage (OH/C, red dots) measured or calculated according to the XPS spectra on the annealing temperature. The lines shown are guides to the eye only. Inset, schematic representation of typical oxygen groups in OHG sheet. Red, purple, and blue balls denote OH-type, ether-type and carbonyl-type O atoms, respectively. C atoms are yellow and H atoms are cyan. (b) Typical fine-scanned XPS spectra of O 1 s. The symbols specify the following groups: I1, I2, I3, and I4 represent carbonyl, epoxy and/or ether, OH, and chemisorbed or intercalated adsorbed water, respectively.

