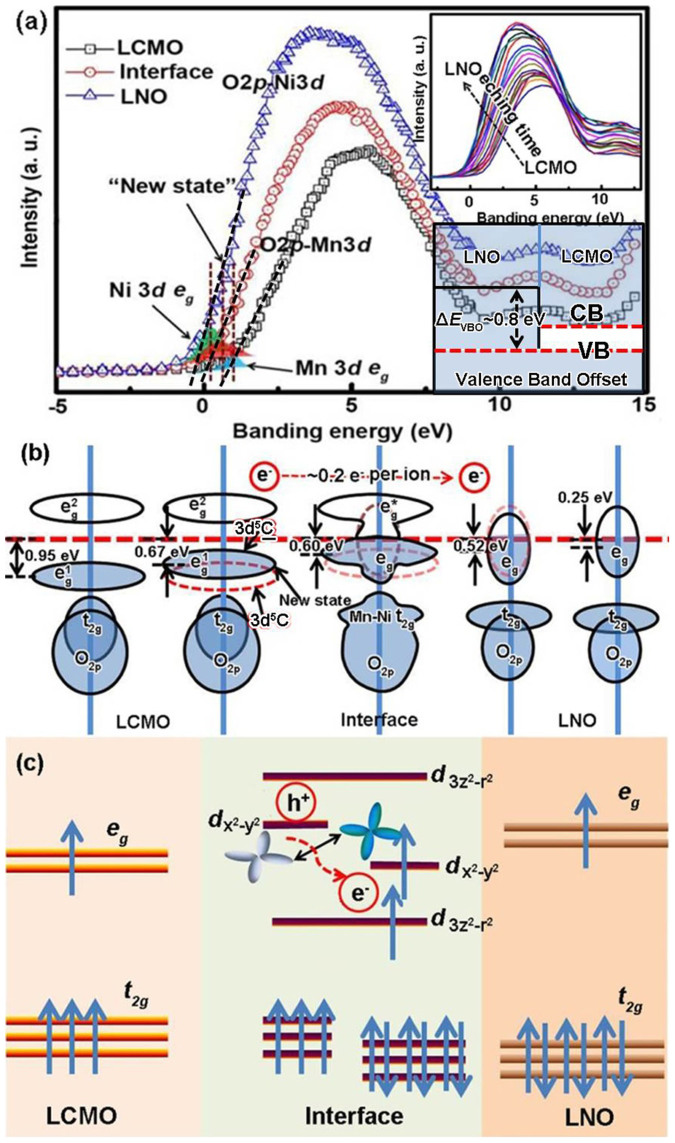
Figure 9.
(a) Survey scans of the valence band record in the LCMO and LNO layers, and at the LCMO/LNO interface. The shadow areas highlight the spectral regions of the eg close to EF. Insert: the valence band continuously shifts from the LCMO layer to the LNO layer and the valence band offset at the LCMO/LNO interface. (b) A schematic of the density of states and the eg band transitions across the interface. (c) A schematic energy diagram showing the orbital reconstruction at the LCMO/LNO interface.

