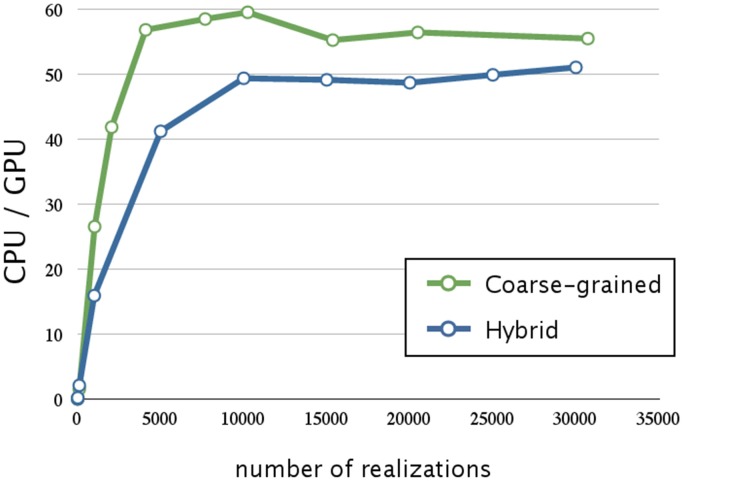
Figure 7.
Performance analysis of memory access optimization w.r.t. the number of realizations. This figure shows a plot of the ratios of the execution times for the decay dimerization model (Table 2) on a CPU (Core i7 2.80 GHz with 12 GB of memory) and on a GPU (NVIDIA Tesla C1060) as the vertical axis, and the number of realizations as the horizontal axis. The blue and green lines represent the acceleration obtained by memory access optimization with hybrid and coarse-grained parallelization, respectively. Applying memory access optimization improved performance by a factor of 3.1; this was 50 times faster than on a CPU. Memory access optimization with coarse-grained parallelization achieved an even greater improvement than that of hybrid parallelization (it was 60 times faster than on a CPU).

