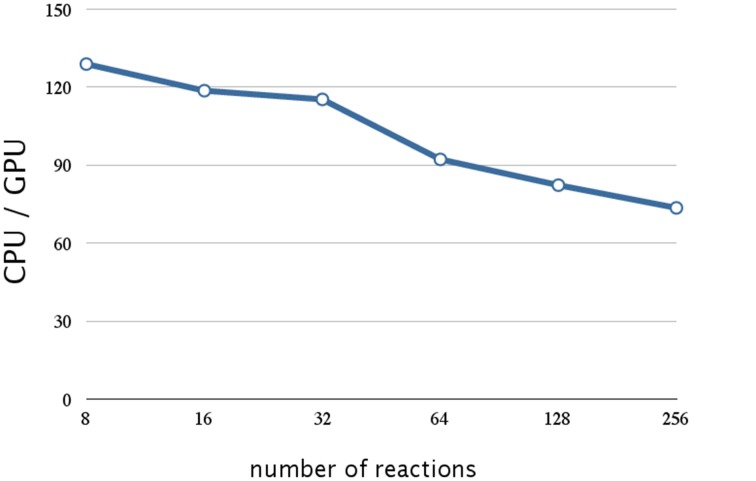
Figure 9.
Performance analysis of data compression w.r.t. the number of reactions. This figure shows a plot of the ratios of the execution times of 10,240 realization of a single-gene production-reduction model on a CPU (Core i7 2.80 GHz with 12 GB of memory) and on a GPU (NVIDIA Tesla C1060) as the vertical axis, and the number of reactions (model size) as the horizontal axis. Compression of the stoichiometry matrix resulted in a further improvement by a factor of 1.4 for a model with eight reactions; this was about 130 times faster than on a CPU. On the other hand, the execution time on a GPU was notably longer for larger models (>64 reactions).

