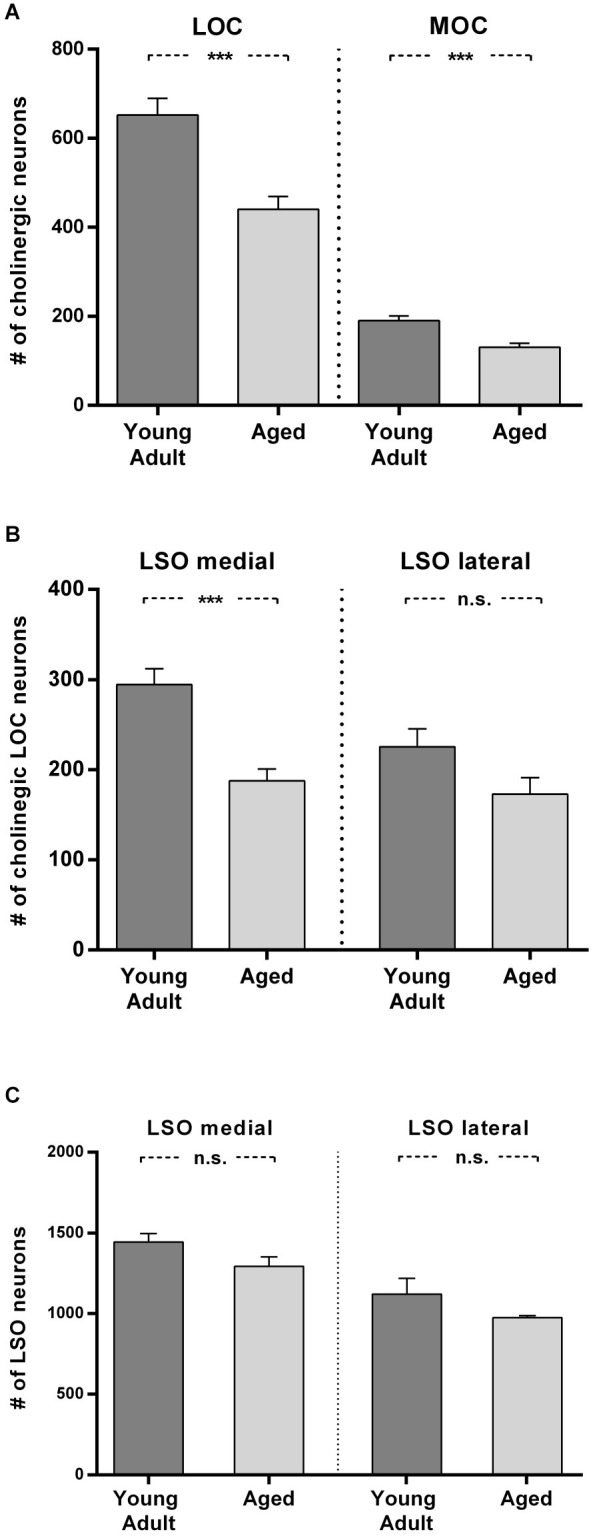
Figure 6.

Loss of olivocochlear (A,B) and LSO neurons in general (C) in aged compared to young adult animals. (A) The mean number of LOC and MOC neurons in one hemisphere is represented for young adult and aged animals. The decrease in OC numbers in aged animals relative to young adult animals is significant in LOC and MOC neurons (LOC: 24%: t = 4.436; df = 18; p < 0.001); MOC: 31%, t = 4.357; df = 18; p < 0.001). (B) LOC neuron numbers in medial and lateral part of LSO in young adult and aged animals. The aged vs. young adult decrease of LOC neurons is −36% in the medial LSO portion (t = 4.888; df = 18; p < 0.001) and −23.4% in the lateral portion (t = 1.96; df = 18; n.s.). The difference of LOC numbers in the medial LSO vs. lateral LSO is not significant neither in young adult (t = 2,608; df = 18; p = 0.0178, n.s.) nor in aged (t = 0.657, df = 18; n.s.) animals. (C) Total number of LSO neurons within an area of interest of the medial and lateral portion of the LSO for young adult and aged animals. The left pair of columns gives the counts in the medial, the right one the counts in the lateral portion of LSO. LSO neurons exhibit only a moderate loss in both subdivisions with 10% in the medial LSO (t = 1.891; df = 6; n.s.) and 13% in the lateral LSO (t = 1.471; df = 6; n.s.). Neuron numbers are given as mean ± SEM. Dark gray columns: young adult animals, light gray columns: aged animals. ***p < 0.001.
