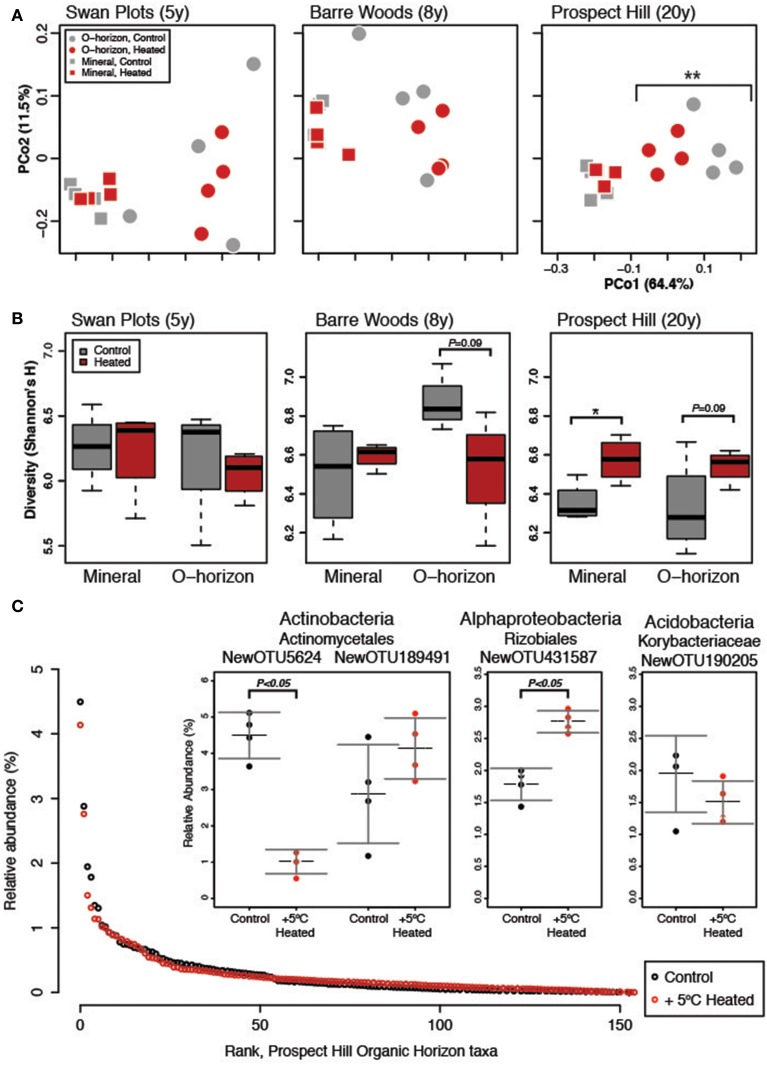
Figure 1.
Measures of diversity for the warming chronosequence, based on the dominant subset community (N = 155). (A) One PCoA ordination was performed on all sites, both treatments and both soil types, but the three sites are shown separately for clarity: SWaN Plots, Barre Woods, and Prospect Hill. (B) Diversity as measured by Shannon's H index is shown for the three sites as box (first and third quartiles) and whisker (95% CI) plots where the solid bar is median. (C) Rank abundance curve of the 155 dominant species in the community, with inset showing the three most abundant taxa and their relative abundance in heated versus control treatments averaged for the three sites. Statistical significance is indicated as *P < 0.05, **P < 0.01.

