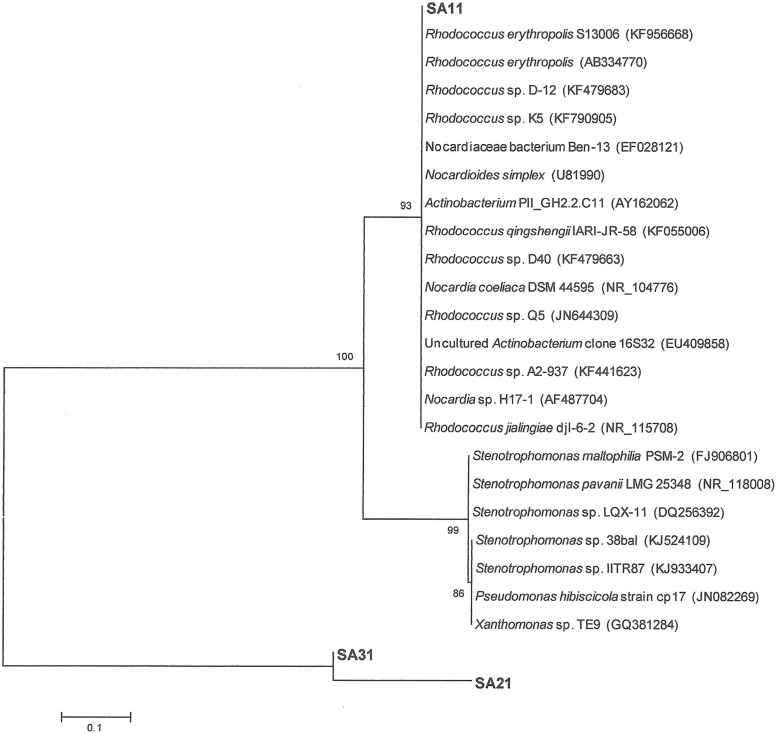
FIGURE 5.
Neighbor-joining consensus tree based on 16S rRNA gene sequence analysis showing the relationship between the strains SA11 and SA 31 and SA21 to the closest relatives in GenBank data base. The bar represents 0.1 substitutions per site and bootstrap values (indicated at the nodes) were calculated from 1000 trees.

