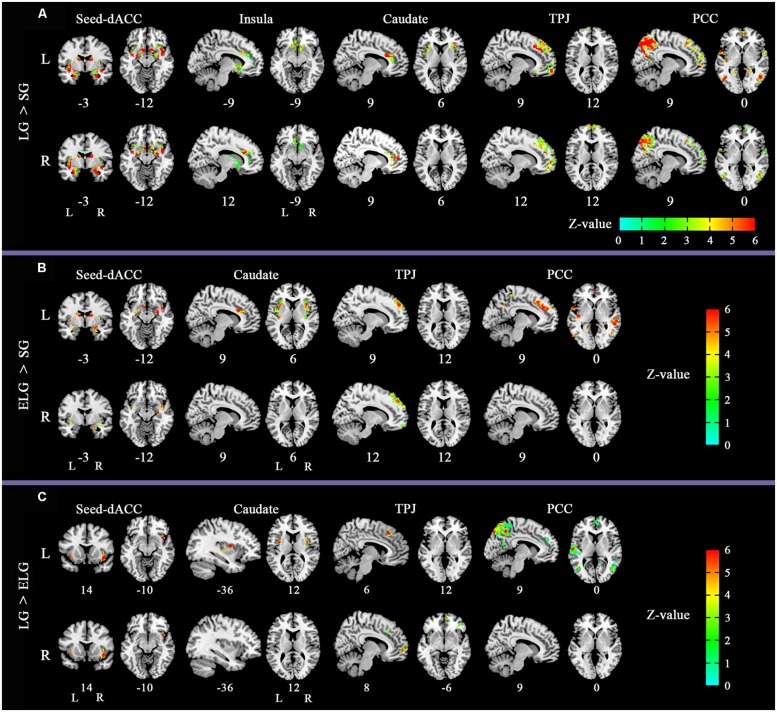
FIGURE 2.
Altered functional connectivity (FC) pattern in comparison across the three groups. Images of FC demonstrates differences in resting-state FC between groups (A) LG > SG, (B) ELG > SG, (C) LG > ELG (see Tables 3–5 for complete results). For each comparison, the top row shows the FC pattern of the left hemisphere and the bottom row shows the right hemisphere. L, left; R, right. All resultants were corrected by FDR correction (P < 0.05). *Coordinates in MNI space.

