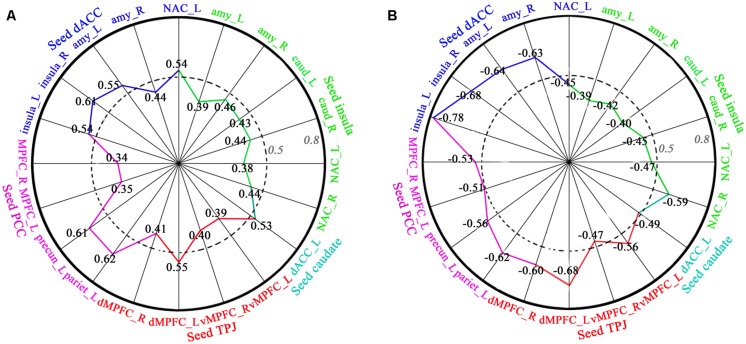
FIGURE 4.
Correlation between FC and length of time in-love (in LG) and the lovelorn duration since breakup of romantic relationship (in ELG). (A) depicts the significant positive correlation between FC and the length of time in-love in LG; (B) shows the significant negative correlation between FC and the lovelorn duration since the breakup of romantic relationship in ELG. Intensity of FC was extracted from ROIs (small sphere of 6 mm radius, the center coordinates are listed in Table 3) based on the results of the FC comparison between the LG and SG (FDR, P < 0.05). The absolute value of the correlation coefficient increases gradually from the center to the circumference. Numbers represent the correlation coefficient, and the colors represent the corresponding brain regions. These are only the results of the right hemisphere. All correlations shown were significant (P < 0.05).

