
FIGURE 3.
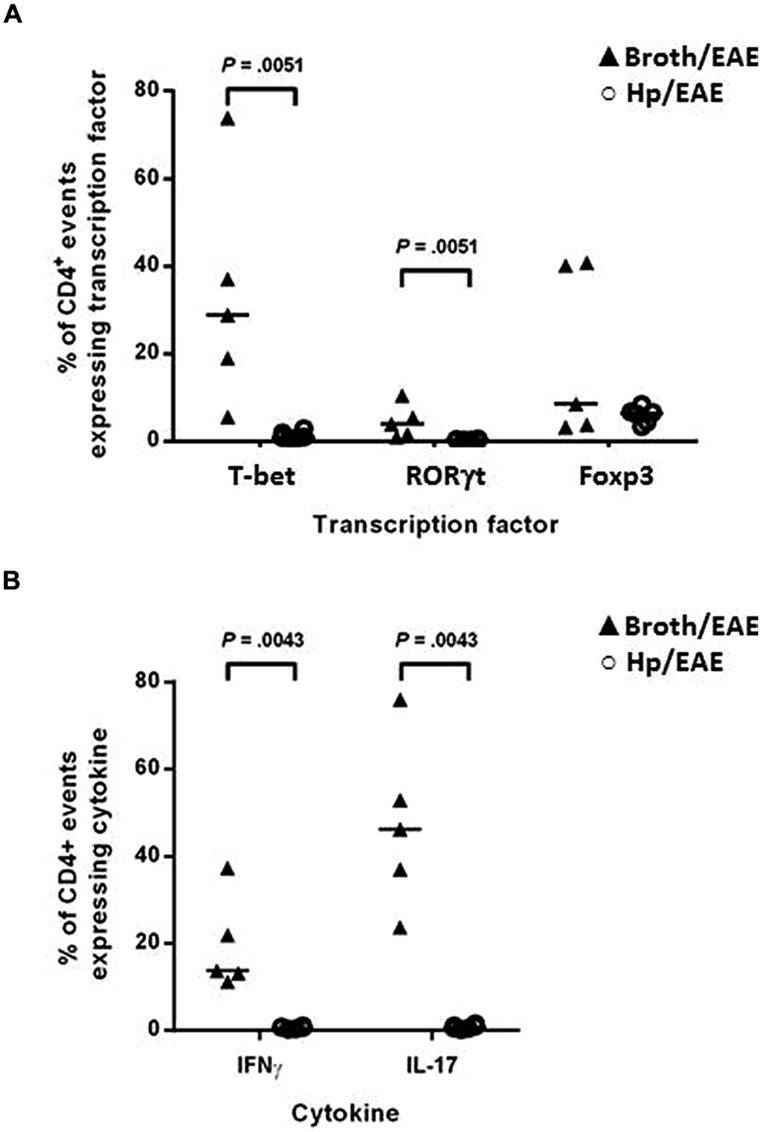
Flow cytometry analysis of splenocytes from infected and uninfected mice with EAE. Groups of six mice were orally inoculated with H. pylori (Hp/EAE) or given Brucella broth as a placebo (Broth/EAE). After 3 weeks EAE was induced in all mice. Spleens were disrupted, stained using fluorochrome-conjugated antibodies and analyzed using flow cytometry. Graphs show the proportion of CD4+ events which expressed the transcription factors T-bet, RORγt, and Foxp3 (A), and the proportion of CD4+ events which expressed the cytokines IFNγ and IL-17 (B). Medians are shown with a horizontal line. p-values were calculated using Mann–Whitney U-tests.