
FIGURE 4.
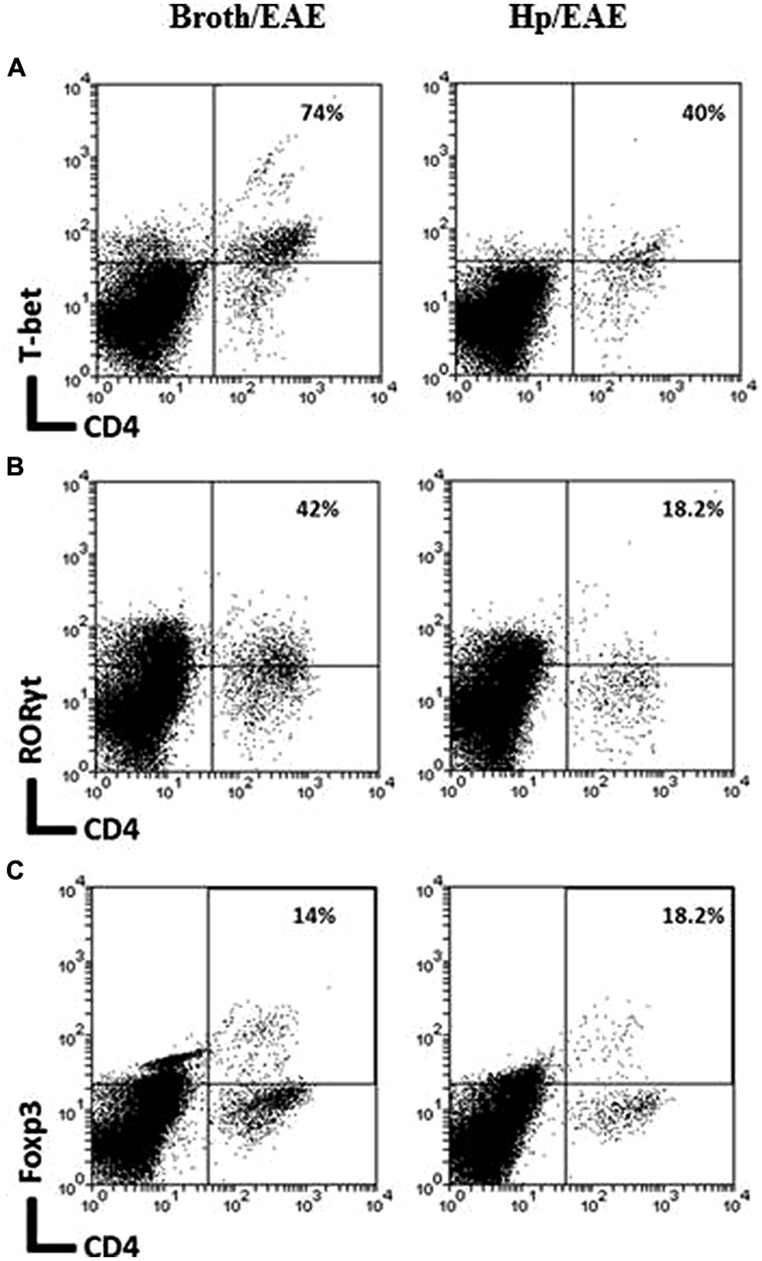
Flow cytometry analysis of pooled cells extracted from the CNS of infected and uninfected mice with EAE. Groups of six mice were orally inoculated with H. pylori (EAE/Hp) or given Brucella broth as a placebo (EAE/Broth). After 3 weeks EAE was induced in all mice. Samples were collected 3 weeks after EAE induction. CNS and brain tissue were pooled from each group of mice (six mice per group). Cells were extracted, stained with fluorochrome-conjugated antibodies and analyzed by flow cytometry. Lymphocyte gated dot plots showing the CD4 and T-bet (A), RORγt (B), and Foxp3 (C) staining. The percentage of CD4+ cells that express each marker is given in the top right hand corner.