
FIGURE 5.
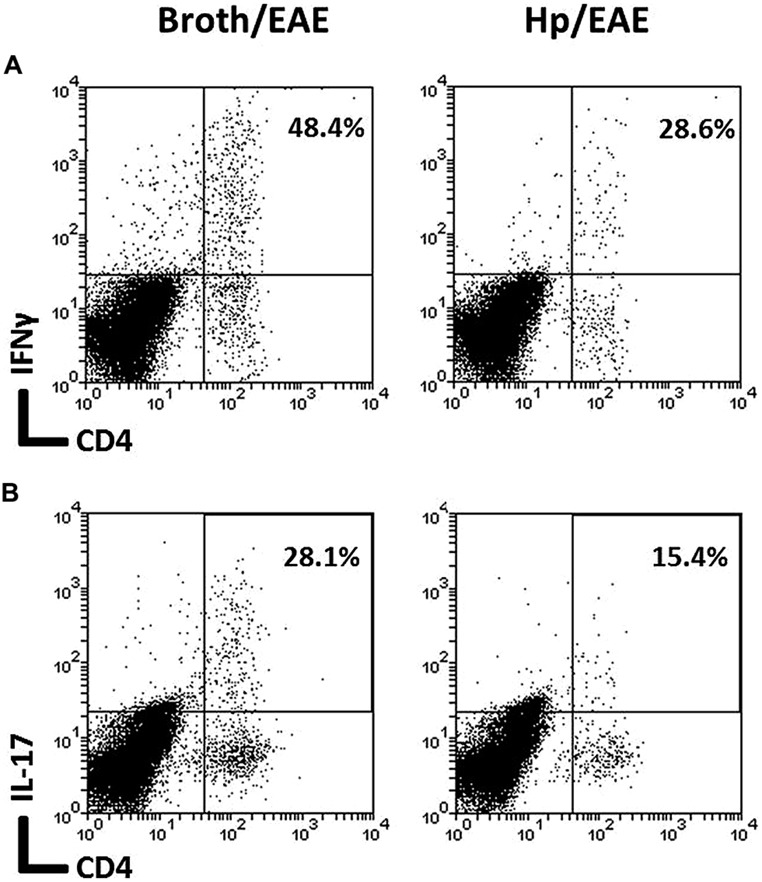
Flow cytometry analysis of cytokine expression on pooled cells extracted from the CNS of infected and uninfected mice with EAE. Groups of six mice were orally inoculated with H. pylori (EAE/Hp) or given Brucella broth as a placebo (EAE/Broth). After 3 weeks EAE was induced in all mice. Samples were collected 3 weeks after induction of EAE. CNS and brain tissue were pooled from each group of mice (six mice per group). Cells were extracted, stimulated with PMA and ionomycin, stained with fluorochrome-conjugated antibodies and analyzed by flow cytometry. Lymphocyte gated dot plots showing the CD4 and IFNγ (A) and IL-17 (B) staining. The percentage of CD4+ cells that expressed each cytokine is given in the top right hand corner.