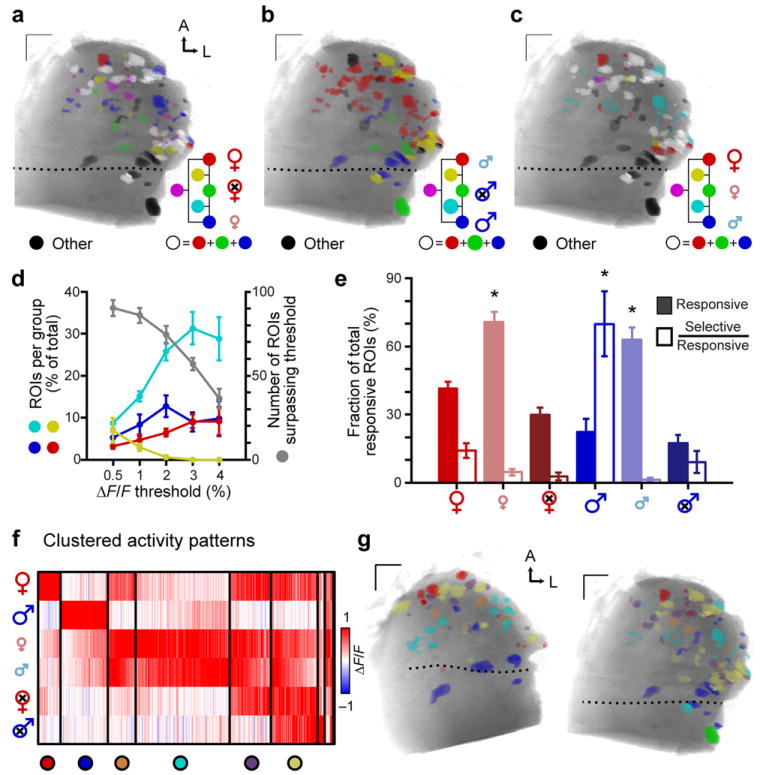
Figure 3. Glomerular maps activated by mouse urine across sex and maturity.

(a–c) Example glomerular response maps to dilute BALB/c urine of different sexes and sexual maturities. Colored voxels indicate responsiveness to 3 selected urines in each panel (ΔF/F > 2%). Color mixtures indicate glomeruli that responded to more than one of the highlighted urines (yellow: red + green, magenta: red + blue, cyan: blue + green, white: all 3). Glomeruli that responded to urine cues other than those highlighted in each panel are colored black. (d) Increasing the ΔF/F threshold reduced the total number of glomeruli (gray symbols, right ordinate), and the prevalence of nonselective glomeruli (yellow symbols, left ordinate). Selectivity for sexually mature female (red symbols), sexually mature male (blue), and juvenile (cyan) urine increased at higher thresholds. (e) The percentage of glomerular ROIs responsive (filled bars) and selective (open bars) for BALB/c mouse urine of different sexes and sexual maturities (ΔF/F > 2%). (f) Cluster analysis of glomerular tuning to 6 urines. Each thin vertical stripe shows an individual ROI and rows indicate the stimuli. Vertical black bars divide the clusters. The color of each thin pixel indicates the normalized ΔF/F for each ROI and stimulus. Colorized circles (bottom) assign unique colors to identify members of each cluster in g. (g) Functional glomerular maps organized by glomerular tuning. ROI color indicates membership in the associated cluster in f. Members of the two smallest clusters are omitted. Dotted lines indicate the position of the linea alba. Scale bars: 100 μm. Error bars represent s.e.m. (n = 5). Asterisks: p < 0.05 (one-way ANOVA).
