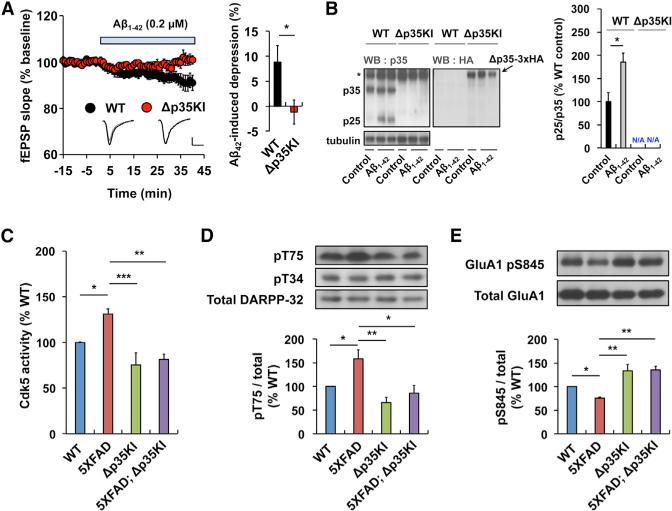
Figure 5. Prevention of Aβ-Induced Synaptic Depression and Excessive DARPP-32 Inhibition and AMPAR Dephosphorylation in 5XFAD Mouse Brain by Blockade of p25 Generation.
(A) Stable basal synaptic transmission was recorded from WT or Δp35KI hippocampal slices for at least 15 min, followed by incubation in Aβ1-42 (0.2 μM) for 40 min. Scale bars, 0.5 mV and 10 ms. Sample traces represent fEPSPs at 1 min before (gray) and 40 min after (black) Aβ1-42 treatment. Right: the magnitude of Aβ1-42-induced depression was calculated by comparing the average slopes of fEPSPs during the last 10 min of recordings with those obtained before Aβ1-42 treatment (WT: 8.8%± 3.3%, 7 slices from 3 mice; Δp35KI: 1.2% ± 2.4%, 6 slices from 3 mice). Student's t test.
(B) Levels of p25 in WT and Δp35KI hippocampus after incubation with Aβ1-42. Δp35 expression in Δp35KI hippocampus was confirmed by immunoblotting with an anti-HA antibody. The asterisk represents a nonspecific background band. Right: the bar graph represents relative immunoreactivity of p25/p35 compared with the WT untreated group (n = 5 per group; Student's t test).
(C) IP-linked Cdk5 kinase assays were performed on WT, 5XFAD, Δp35KI, or 5XFAD;Δp35KI hippocampal lysates (n = 5 per group).
(D) The relative immunoreactivity of DARPP-32 pThr75/total DARPP-32 was normalized to WT (n = 4–6 per group; p < 0.01 by ANOVA).
(E) The relative immunoreactivity of GluA1 pSer845/total GluA1 was normalized to WT (n = 3 per group; p < 0.01 by ANOVA). *p < 0.05, **p < 0.01, ***p < 0.001 by Student's t test or Tukey's post hoc analysis; error bars ± SEM. See also Figure S5.

