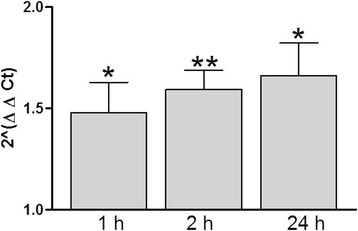
Figure 4.

Shift of CD1d mRNA expression with increased duration of SEB exposure: Real-time PCR was carried out on RNA extracted and converted to cDNA from SEB-exposed RPTECs. 1 x 10⁶ cells/ml RPTECs were exposed to 100 μg/ml SEB for 1 h, 2 h and 24 h (N =3). Data are expressed as fold-change compared to the controls for each time point and represent the 2ΔΔCt (± SE). Welch’s t-test p value cut-offs were designated by * < 0.05 and ** < 0.01.
