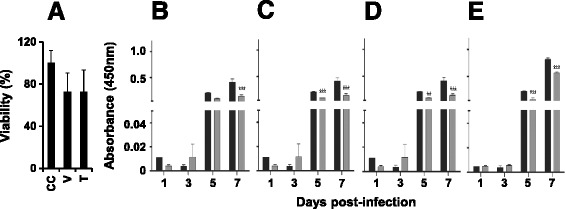
Figure 4.

Evaluation of antiviral activity using cell-based assay. (A) Histogram showing the viability of Vero cells that received no drug (‘CC’, cell control), 1% DMSO vehicle alone (‘V’) or 10 μM MB21 in 1% DMSO vehicle (‘T’). Panels B-E depict the effect of MB21 on NS1 secretion by DENV-infected cells. Vero cells were infected with DENV-1 (B), DENV-2 (C), DENV-3 (D) or DENV-4 (E) either in the absence (black bars) or presence (grey bars) of MB21. Culture supernatants withdrawn at the indicated time points during the 1 week experiment, were tested for viral antigen levels using the Dengue NS1 ELISA kit (the NS1 ELISA absorbance scale on the Y-axis is the same for panels B-E). Data shown are mean values (n = 3). The vertical bars represent standard deviation, SD. Two-way ANOVA and Bonferroni post-test analysis was done using GraphPad Prism. P values were either significant (**) or very significant (***).
