Figure 3.

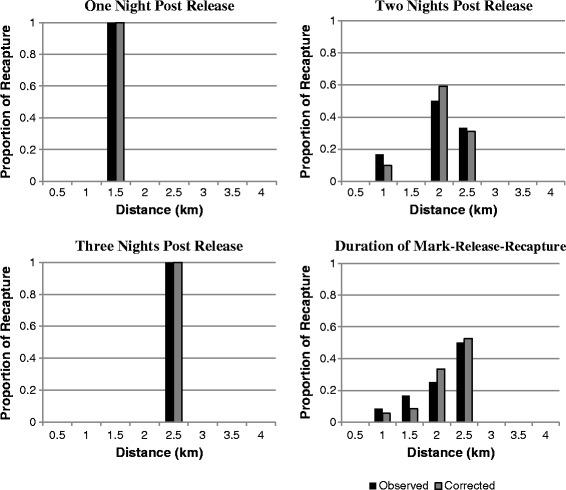
Histograms of observed and corrected data at three post-release times and pooled for the entire mark-release-recapture period.

Histograms of observed and corrected data at three post-release times and pooled for the entire mark-release-recapture period.