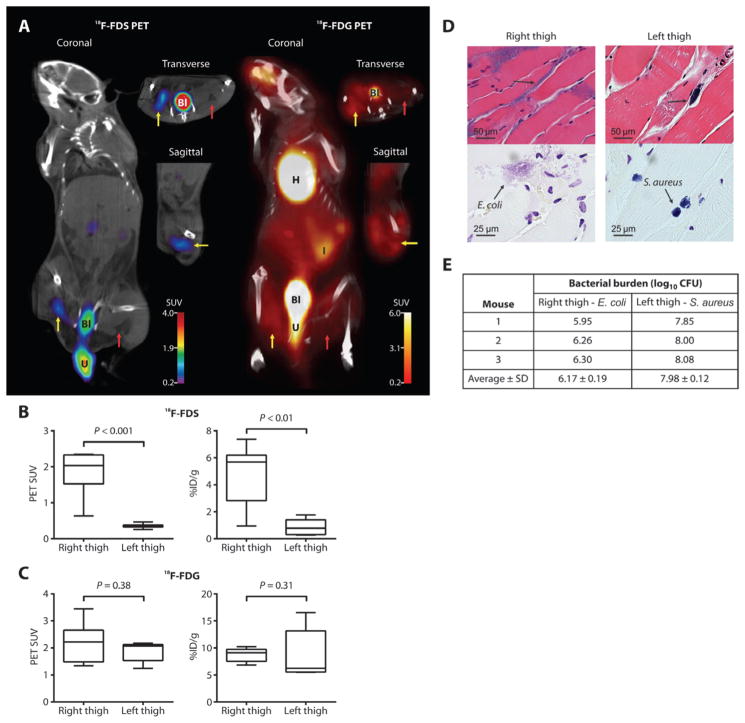
Fig. 4. PET/CT imaging of mixed myositis thigh infection.
(A) 18F-FDS PET signal was observed in the E. coli–infected right thigh (yellow arrow), but not in the S. aureus–infected left thigh (red arrow). 18F-FDG signal was noted in both E. coli– and S. aureus–infected thighs. U, extravasated urine. (B and C) 18F-FDS (B) and 18F-FDG (C) PET signals in vivo from the infected thighs and postmortem biodistribution. Data are medians with in-terquartile and ranges shown (n = 7 animals each for 18F-FDS and 18F-FDG). P values were determined by two-tailed Mann-Whitney U test. (D) H&E and Gram stains demonstrating Gram-negative (right thigh) and Gram-positive (left thigh) bacteria. Images are representative of five animals. (E) Bacterial burden immediately after completion of 18F-FDS PET imaging in each mouse (n = 3) in one of the dually infected imaging cohorts.

