Fig. 1.
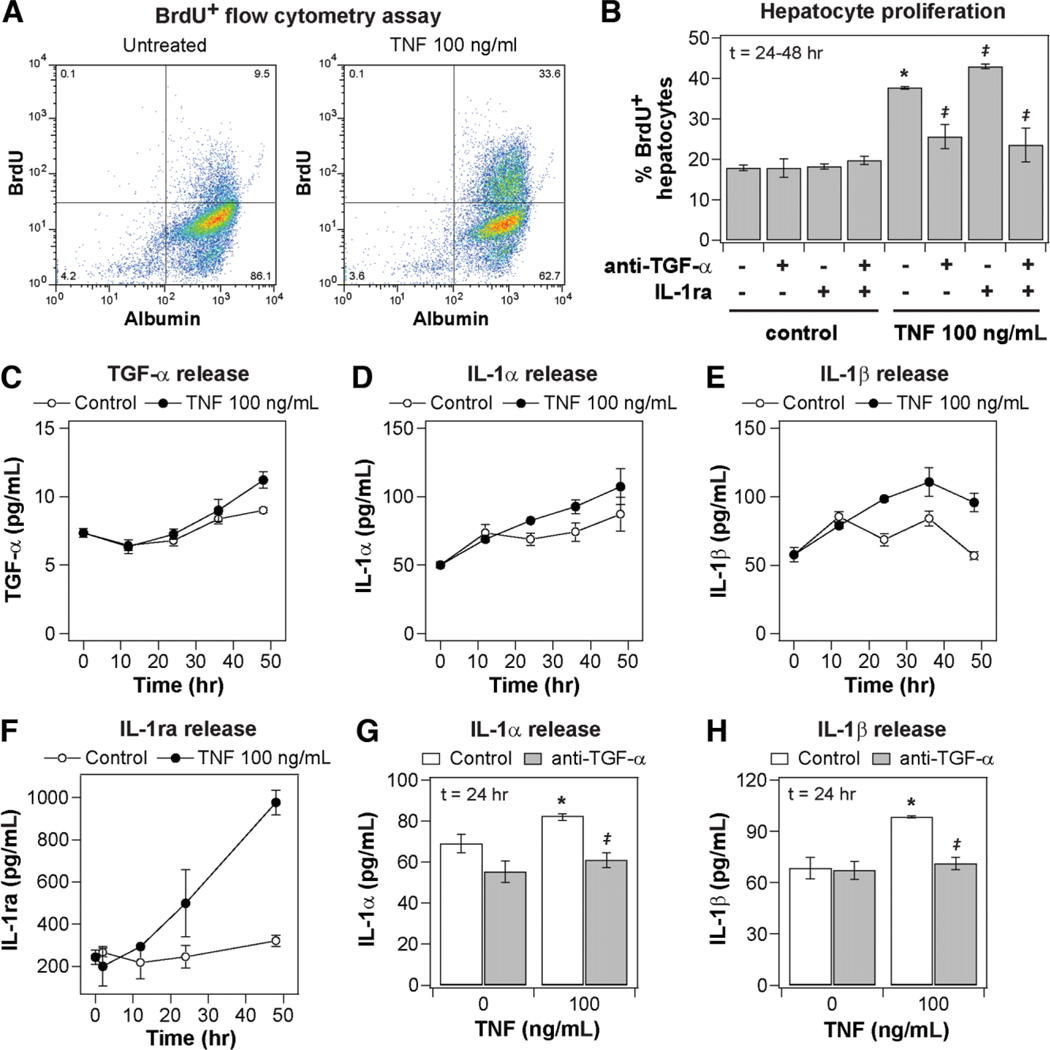
Coupled and self-antagonizing autocrine TGF-α, IL-1α/β, and IL-1ra circuits regulate TNF-induced hepatocyte proliferation. Primary rat hepatocytes were isolated, treated, and assayed as described in the Supplementary Experimental Procedures for proliferation studies. (A) Representative scatter plots of BrdU+ flow cytometry assays for cells stimulated with carrier only (left) or 100 ng/mL TNF (right). The proliferative fraction of cultured hepatocytes is reported as percentage of BrdU+ cells within the albumin+ (hepatocyte) population. (B) Regulation of TNF-induced hepatocyte proliferation by autocrine TGF-α and IL-1α/β. Autocrine TGF-α and IL-1α/β ligand activity was inhibited by pretreatment with 10 µg/mL anti-TGF-α and/or 10 µg/mL IL-1ra 1 hour before mock or 100 ng/mL TNF treatment. (C–F) Conditioned media samples were collected from 0 to 48 hours following mock or 100 ng/mL TNF treatment and were assayed for (C) autocrine TGF-α, (D) IL-1α, (E) IL-1β, and (F) IL-1ra release by quantitative enzyme-linked immunoabsorbent assay (ELISA). Differences between each pair of ligand release time courses were assessed using two-way ANOVA (TGF-α: P< 0.022; IL-1α: P< 0.032; IL-1β: P< 10−4; IL-1ra: P< 0.005). (G–H) Perturbation of TNF-induced IL-1α and IL-1β release at 24 hours after stimulus in the presence of 10 µg/mL anti-TGF-α. In (B), (G), and (H), differences between mock and TNF treatments are labeled as significant (*) if P< 0.05. Differences between pairs of uninhibited and inhibitor treatments are labeled as significant (‡) if P< 0.05. Data are presented as the mean ± SEM of three biological samples (B,F–H) and in six biological samples (C–E).

