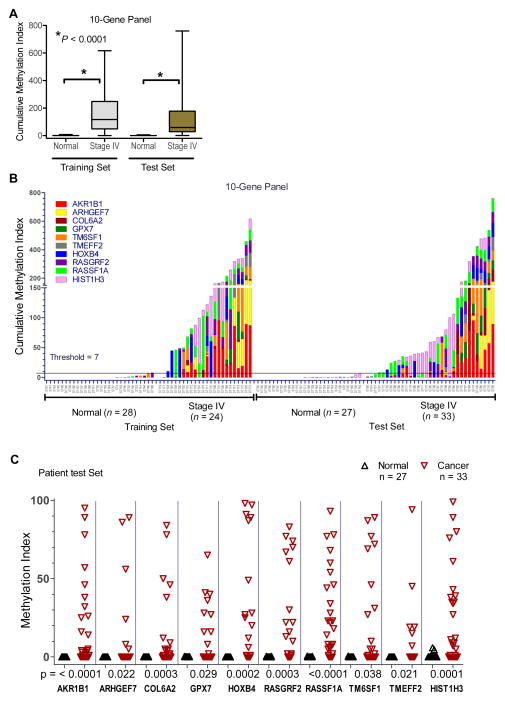
Figure 3. Evaluation of the 10-gene panel by cMethDNA assay.
Serum from patients with recurrent metastatic stage IV disease were assigned to Training and Test sets. A) Box plot shows that cancer sera display significantly higher median cumulative methylation than normal sera (p< 0.0001. Mann-Whitney). B) Cumulative cMethDNA assay values (CMI; Y-axis) were calculated for individual samples, each colored segment representing the methylation index for an individual gene. ROC analysis was performed on data collected from the Training set to define a normal laboratory methylation threshold (CMI = 7 units; Y-axis). C) Frequency of methylation for individual biomarkers in the 10-gene panel.
Scatter plot depicts gene methylation intensity (Y-axis, methylation index) for individual genes (X-axis) in the Test set for normal and cancer sera, indicated in the legend. The Mann-Whitney p-values are shown below each plot. Statistical analysis of Training and Test sets for the 10-gene panel and the methylation frequency of individual genes is shown in Table 2.

