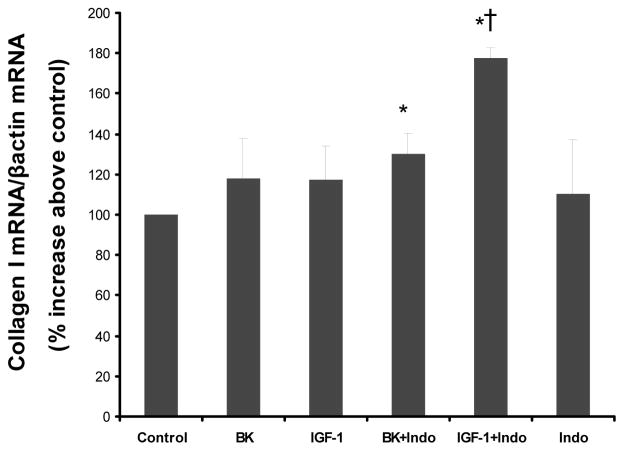
Figure 8. Effect of cyclooxgenase inhibitors on BK-induced and/or IGF-1 induced collagen I mRNA expression.
VSMC were pretreated with Indomethacin (Indo 50μM), a cyclooxygenase inhibitor, followed by BK (10−8M) or IGF-1 (10−8M) stimulation for 6h. Collagen I and β-actin mRNA levels were measured by real-time PCR. The bar graph represents the relative intensities of collagen I mRNA levels/ β-actin mRNA levels. Blot shown is representative of 3 experiments. *P<0.04 vs. control; †P<0.02 vs. IGF-1.

