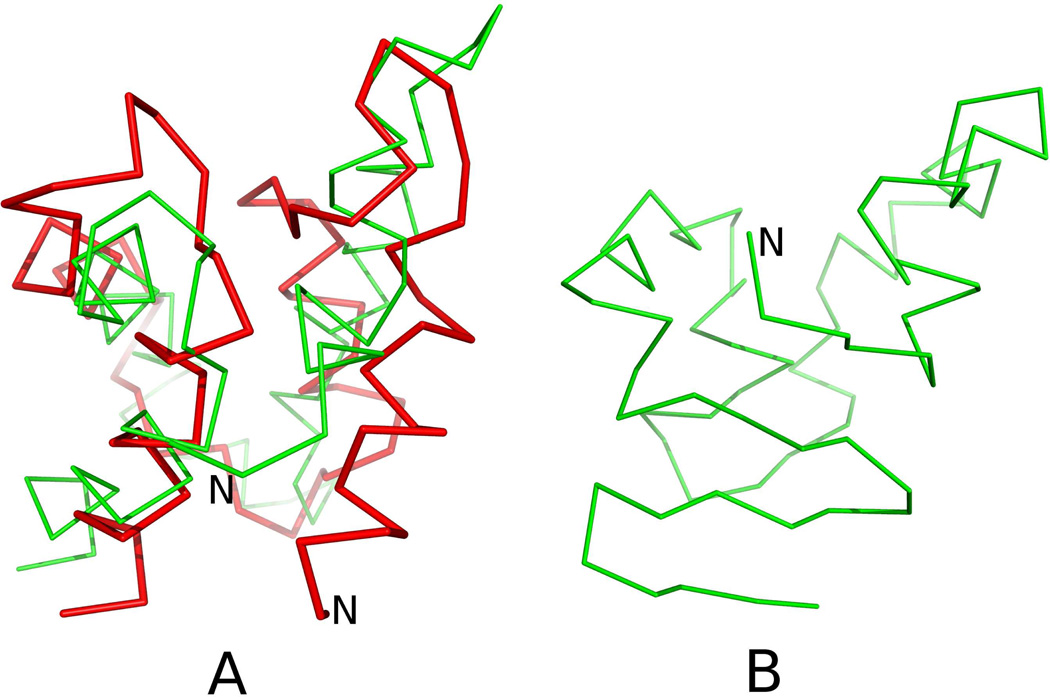
Fig. 12.
A: Superposition of the Cα-trace of the average structure of the most probable cluster of conformations of 1KOY obtained in MREMD simulations with inclusion of the potentials derived in this work (green lines) on that of the experimental structure of 1KOY (red lines). B: the average structure of the most probable cluster of conformations of 1KOY obtained in MREMD simulations with wSC−corr = 0.0, wtor = 1.84316, wtord = 1.26571 (without new potentials). The RMSDs from the experimental structure are 5.25 Å for panel A, and 9.23 Å for panel B, respectively.

