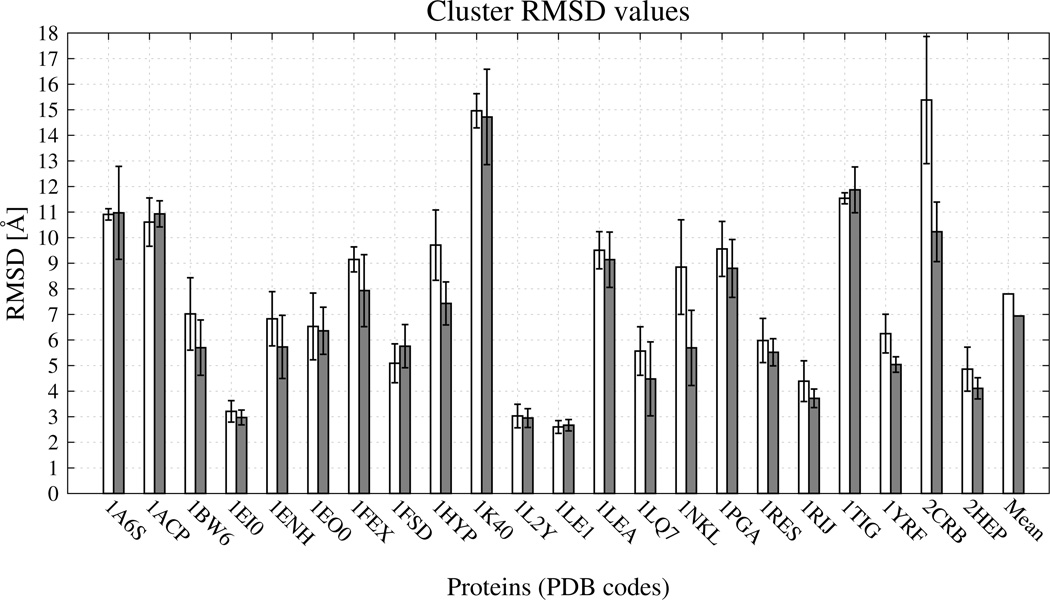
Fig. 14.
Bar diagrams of the RMSDs of the mean structures of the most native-like clusters [ of eq 11] for the 22 test proteins corresponding to clustering at T = 290 K. White bars: the UNRES from force field without new terms. Light-grey bars: the UNRES force field with the new terms and optimal energy-term weights (wSC−corr = 0.25, wtor = 1.34316, wtord = 1.26571). For each protein and each force field, the error bar represents the standard deviations of the RMSDs of the structures of the most native-like cluster from the RMSD of the average structure of that cluster.

