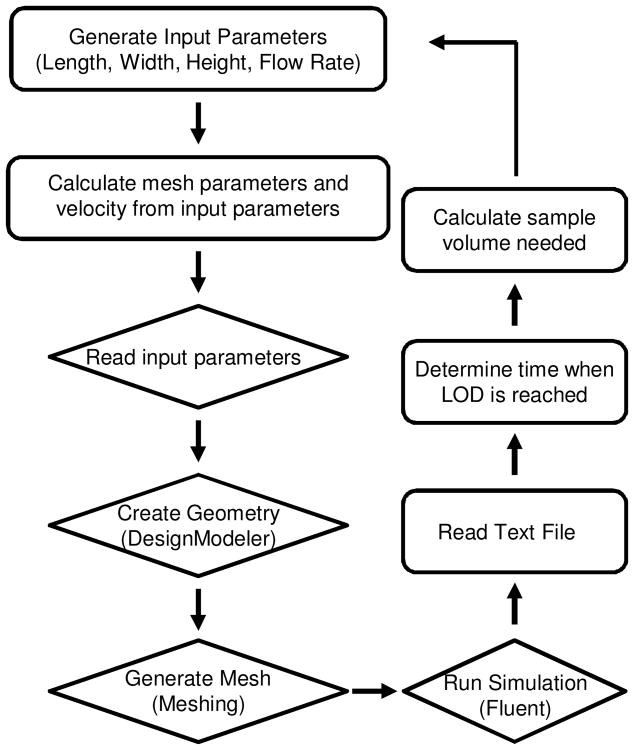
Fig. 2.
Schematic representation of the optimization workflow. Operations in rectangles and diamonds are performed in modeFrontier and Ansys Workbench, respectively. The velocity and meshing parameters are calculated from the input parameters and fed into Ansys Workbench. The geometry is created in Ansys DesignModeler and exported to Ansys Meshing to discretize the volume. Ansys Fluent solves the governing equation and outputs a text file containing the amount of protein bound in the bead bed at each time step calculated as a volume integral of antibody-antigen complex concentration across the reaction volume. The text file is read by modeFrontier and the data is used to determine the time at which the LOD has been reached. The sample volume is calculated from the product of incubation time required to reach the LOD and the flow rate. For DOE, the process is repeated for the next set of input parameters from the full factorial experimental design. For optimization studies, the algorithm adjusts the input parameters in an attempt to minimize the design objectives

