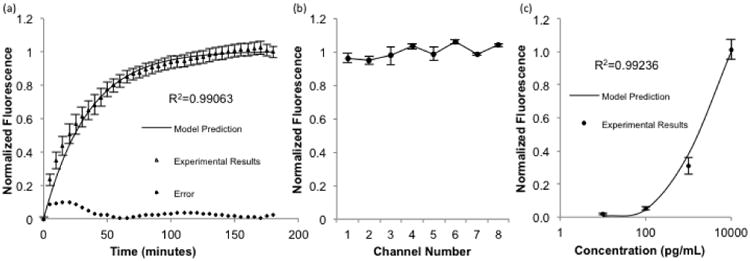
Fig. 4.

a) Comparison of model predictions with time lapse fluorescence data using 10 ng/mL concentrations of biocytin-Alexafluor 488 in all eight sample inlets. Error is defined as the difference between the model prediction and experimental results (n=24, R2=0.99063, p>0.25 by lack-of-fit sum of squares test) b) Beads from the time lapse experiment were collected and analyzed by flow cytometry, with no significant difference in the measured fluorescence between device channels (n=6, NS, p=0.14 by one way ANOVA) c) Different concentrations were each flowed through two sample inlets, collected, analyzed by flow cytometry, and compared with model predictions. (n=6, R2=0.99236, p>0.25 by lack-of-fit sum of squares test). Error bars represent standard error of the mean
