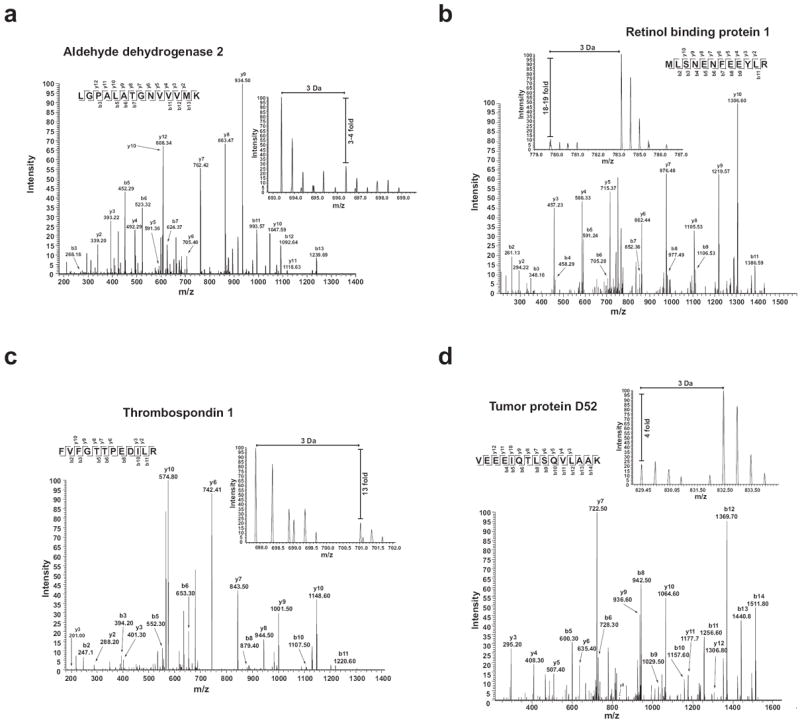
Figure 3. Representative peptide MS/MS fragmentation pattern and H/L precursor ion ratio spectrum.

The representative MS/MS and MS spectra from 6 proteins are shown. a) Aldehyde dehydrogenase 2; b) Retinol binding protein 1; c) Thrombospondin 1 and d) Tumor protein D52. In each panel, the inset shows the relative ratio of Heavy to Light versions of each precursor ion.
