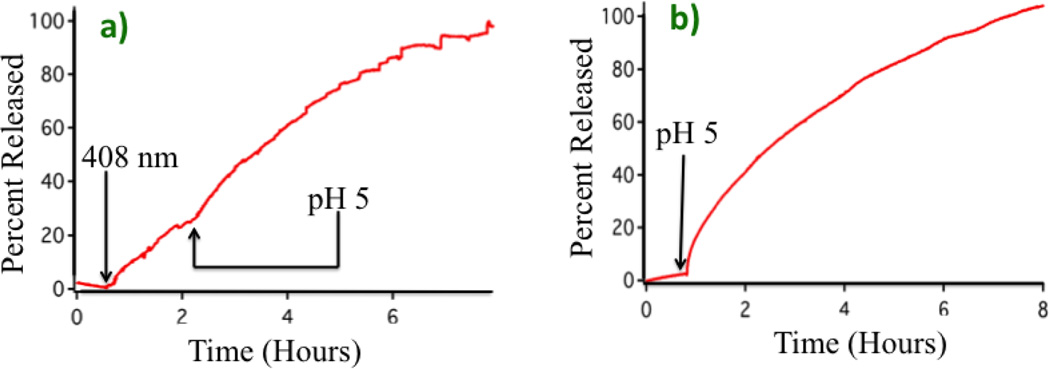
Fig. 3.
Comparison between photoacid and bulk acidification on the release profiles. a) Release profile caused by 10 mW, 408 nm pump laser photoactivation for two hours, followed by solution acidification to pH 5. Both traces are on the same scale. b) Release profile caused by bulk acidification to pH 5 using HCl.

