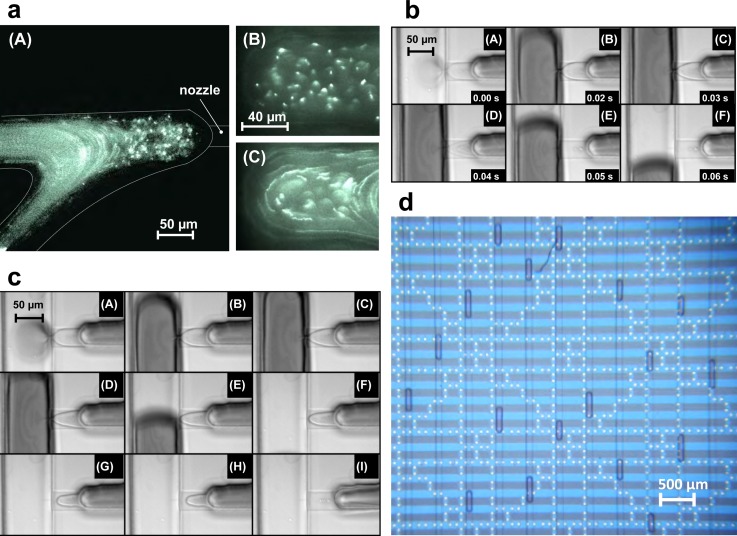
FIG. 4.
Droplet formation microscope images. (a) Fluid flows in nozzles. (A) Fluid flow profile near the vicinity of the nozzle, flow rate in side channel: 100 μl/h using 100 nm size fluorescent beads, (10× magnification). (B) Magnified view region near to the nozzle tip, with stable interface (60× magnification). (C) Flow profile near the nozzle tip during droplet formation (60× magnification). (b) Stages of droplet formation with short impulse time. Flow rates in side channel: 100 μl/h, central channel: 20 μl/h, impulse time: 0.05 s. Images show (A)–(C) filling up during the pressure impulse, (D) and (E) pinch off at the end of impulse, and (F) droplet motion and interface relaxation. (c) Stages of droplet formation with long impulse time. Flow rates in side channel: 100 μl/h, central channel: 20 μl/h, impulse time: 4 s. Images show (A) and (B) filling up during the pressure impulse, (C) and (D) necking due to fall of pressure with time, (E)–(H) droplet pinch off and presence of two phase interface in the nozzle, and (I) interface retraction at the end of pressure impulse, with long relaxation time. (d) Generated droplet population on the chip. In this case, ionic liquid is used as a carrier fluid, and the aqueous droplets are observed on chip in a long meander. The microelectrodes visible below the meander structure were not used in this experiment, but confirm that our one-layer PDMS DoD system is readily integrated with other microsystem components—in this case on the substrate.

