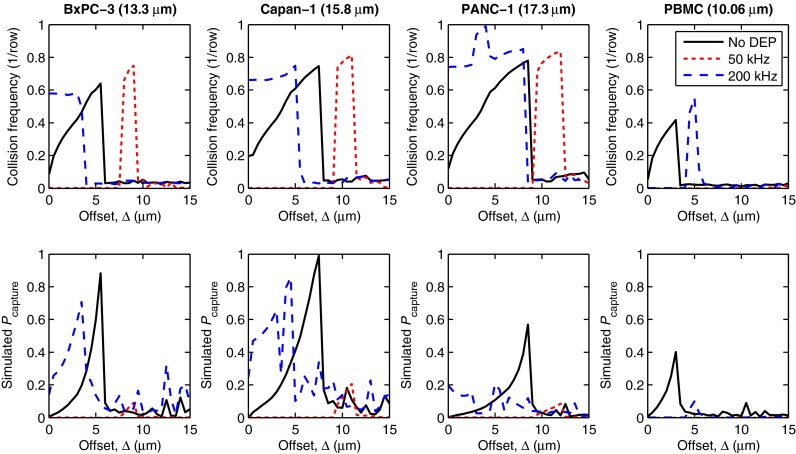
FIG. 4.
Simulated collision frequency (top row) and capture probability (Pcapture, bottom row) are shown vs. offset (Δ) for four cell types: BxPC-3, Capan-1, and PANC-1 pancreatic cancer cells; and PBMCs. At 50 kHz, all of the cells experience nDEP. At 200 kHz, the pancreatic cells experience pDEP and are attracted to the obstacles, increasing Pcapture; simultaneously, PBMCs experience nDEP at 200 kHz and are repelled from the obstacles, decreasing Pcapture. Note that Pcapture for PANC-1 is much lower than the other pancreatic cancer cells due its smaller A value (see Table I) and the displacement of some PANC-1 cells onto high collision frequency, high shear stress trajectories at 200 kHz (see supplementary Fig. S143 ).

